
Optical Filters FAQs
Here we have provided comprehensive lists of commonly asked questions regarding our Semrock optical filters and related applications. This information is designed to support your inquiries, but if you don’t find the answers you are looking for we encourage you to contact us for further assistance.
Please use the sort buttons in the left navigation to navigate between questions and answers that are specific to Optical Imaging Systems, Fluidics, Cameras, Microfluidics, our Webstore, and Engineering Partnership.
What are limitations of conventional spectral measurement?
Why might a customer’s filter spectrum measurement differ from the Semrock spectrum?
Commercially available spectrophotometers are optimized for specific scientific and industrial applications. Because their designs have been constrained by price and performance requirements, most commercial spectrophotometers have insufficient precision to accurately measure the spectral characteristics of high-performance optical filters, especially filters with steep spectral edges and deep blocking, which are Semrock hallmarks. Functional limitations in light sources, detectors, and diffraction gratings, and in their combined performance, can create artifacts in the spectral measurement of such high performance optical filters. A customer's filter spectrum measurement may differ from the measurement performed at Semrock due to the presence of these artifacts. Understanding the origins of such measurement discrepancies enables inference of the filter’s actual performance and provides guidance for decision making.
- Feature Rounding
The spectral features of an optical filter often appear rounded when measured using a conventional spectrophotometer. This artifact occurs when the probe beam is not strictly monochromatic. The slight spectral width of the probe beam causes a "smoothing" effect that rounds sharp transitions. In the graph shown here, feature rounding has softened the transition at the beginning of the transmission band. - Noise Floor
A light detector has a sensitivity limit beyond which it cannot report variations in light intensity. This cutoff level sets a limit to the highest optical density (OD, defined as -log10(T)) that a spectrophotometer can measure. The measured OD may, therefore, appear lower than the actual filter performance. When illuminated by light levels below the sensitivity limit, the detection system will report zero signal, but will also report any noise originating within the detector. On a graph this appears as a "noise floor" that corresponds to the highest OD measurable by the spectrophotometer. In the figure, the noise floor is the “noisy” spectral region at the lower left corner of the graph. The noise floor may be wavelength-dependent because of variations in both the light source spectrum and the light detector spectral response. - Sideband Artifact “Kink”
A conventional spectrophotometer sometimes reports a "kink" in the spectrum when measuring a filter with an extremely steep transition between blocking and transmission. In the figure, the kink is the point at which the spectrophotometer measurement diverges from the design spectrum. If present, the spectral kink usually appears between OD 2.5 and 4.5, and can give the impression that the filter's spectral transition is less steep than the actual filter performance. The kink occurs because imperfections in the diffraction grating can create noise sidebands in the spatial profile of the probe beam. If a probe beam has significant sideband noise, and if the filter has a very steep edge, then the light from the noise sideband may transmit through the filter's passband even though the filter has blocked the primary portion of the probe beam. The unwanted transmission lowers the measured OD at that wavelength, creating the characteristic “kink” in the sideband.
For further information on the process that Semrock uses to guarantee filter performance, download our white paper, Advanced Spectral Measurement Systems and Semrock Optical Filters.
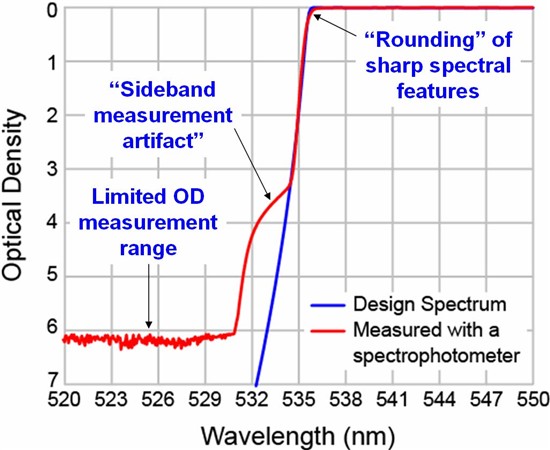
Example showing design and measured spectra of a Semrock LP03-532RU-25 RazorEdge® filter. The measurement was made using a commercial spectrophotometer