Advanced Spectral Measurement Systems and Semrock Optical Filters
Abstract
Innovation in product design often drives innovation in tool design. So it has been at IDEX Health & Science with its line of Semrock optical filters. The need for increasingly demanding spectral specifications has required new tools capable of corresponding spectral measurements. Key among these specifications are optical blocking levels and spectral edge steepness measured from UV to NIR wavelengths over a wide range of angles. This white paper summarizes the features of the proprietary tools developed by IDEX Health & Science, including the established Peregrine and the new KolaDeep™ Spectral Measurement Systems.
Introduction
The steady advances in optical thin film deposition technology and filter design over recent decades have enabled production of complex, highly optimized optical filters that address the increasing demand for higher performance. Notable among these critical performance requirements are the transition from high transmission to deep blocking over a narrow wavelength range, resulting in steep and deep spectral edges, and very high optical blocking levels. For example, higher accuracy and sensitivity of Raman-based instrumentation require the optical system to collect and resolve signal ever closer to the laser line, in turn requiring optical filters with deeper blocking at the laser line and shorter transition width to high transmission. More broadly, innovation in fluorescence instrumentation also drives the need for higher performance filters to efficiently and selectively transmit the desired wavelengths while blocking unwanted light for superior sensitivity and specificity. Finally, certain applications demand precise spectral edge placement, along with steep edges and deep blocking, placing a premium on fine, reproducible wavelength measurement resolution.
Commercially available spectrophotometers represent the starting point for both optical filter customers and filter manufacturers alike, who must assess the actual spectral performance of their filters. It’s important to recognize that inherent limitations of these systems can result in inaccurate determinations of thin-film interference filter properties, especially in cases of steep and deep spectral edges.
A customer relying on a standard commercial spectrophotometer therefore cannot always be sure that purchased filters meet the stated spectral specifications. This can lead to system performance uncertainties in prototype instruments and, in the worst case, to errors such as incorrect output data in production systems.
A similar set of problems confronts the filter manufacturer using a standard commercial spectrophotometer system, especially with the steepest and deepest spectral features. Typical workarounds involve alternative, more complex approaches using theoretical estimates, measurements made on samples, and work by skilled technicians. A manufacturer may even over-specify and over-design filters to assure that no out-of-specification filter is shipped, thereby impacting manufacturability, cost, and delivery schedule.
Semrock, Inc., faced these challenges in the early 2000s, before its integration into IDEX Health & Science in 2015 with its line of Semrock® optical filters, when it introduced the new high-performance ion beam sputtered optical filters to the biology marketplace. In response, Semrock initiated development of a proprietary set of spectral measurement systems (SMS), which have been steadily improved over the years. Today these systems constitute the workhorse Peregrine SMS, a fully adjustable metrology platform used for most spectral measurements, having both high spectral resolution and sensitivity that overcomes the limitations of standard metrology equipment.
To meet the newer metrology challenges and enhance its manufacturing capabilities, IDEX Health & Science developed the KolaDeep SMS, released in 2021. This platform complements the existing Peregrine SMS, allowing measurement of the most challenging spectral features such as deep blocking and very steep spectral edges of thin film coatings in a high-volume production environment.
This paper first introduces the key novel capabilities of the KolaDeep SMS and illustrates these capabilities with measurements on newly designed or remeasured optical filters. The paper then describes the Peregrine SMS, with examples of limitations on accurate spectral measurements using commercially available spectrophotometers, and technology improvements to this fully customized SMS that have enabled IDEX Health & Science to stay at the forefront of optical filter design and production.
KolaDeep SMS
The challenge inherent in accurate measurement of deep blocking provided by steep spectral edges of next-generation high performance optical filters lies in the very low transmission level (deep blocking) at wavelengths very near a high transmission wavelength range. A compatible SMS simultaneously requires high spectral resolution and high dynamic range (i.e., low noise), with a sufficiently small and collimated probe beam.
The KolaDeep SMS, named for the Kola Superdeep Borehole near the Norwegian-Russian border, is a new customized spectral measurement system, designed to address this metrology challenge and allow measurement on the most demanding thin film coatings. Recently recognized for its innovative capabilities [1], this device uses proprietary methods to deliver best-in-class sensitivity without compromising spectral resolution. KolaDeep measures at a precise angle of incidence (AOI) at any angle from 0° to 60°, with a much smaller Cone Half Angle (CHA, 0.3°) than any commercial spectrophotometer (with typical CHA near 3°), and with a much smaller spot size (2 mm diameter) than commercial spectrophotometers (typical values near 20 mm). Blocking to OD 8 can be measured across the UV, visible, and NIR spectra, and to OD 11 for specific spectral features. A further key attribute is the capability to resolve very steep edges, steeper than 0.2% relative to the edge wavelength between 90% transmission and beyond OD 7.
The IDEX Health & Science optical filters engineering team that developed this new proprietary system have performed extensive qualification testing to characterize and confirm the wavelength and photometric accuracy of the system, resulting in very strong agreement between measurement and theory, as will be seen from examples in this paper.
Prove deep out of band blocking
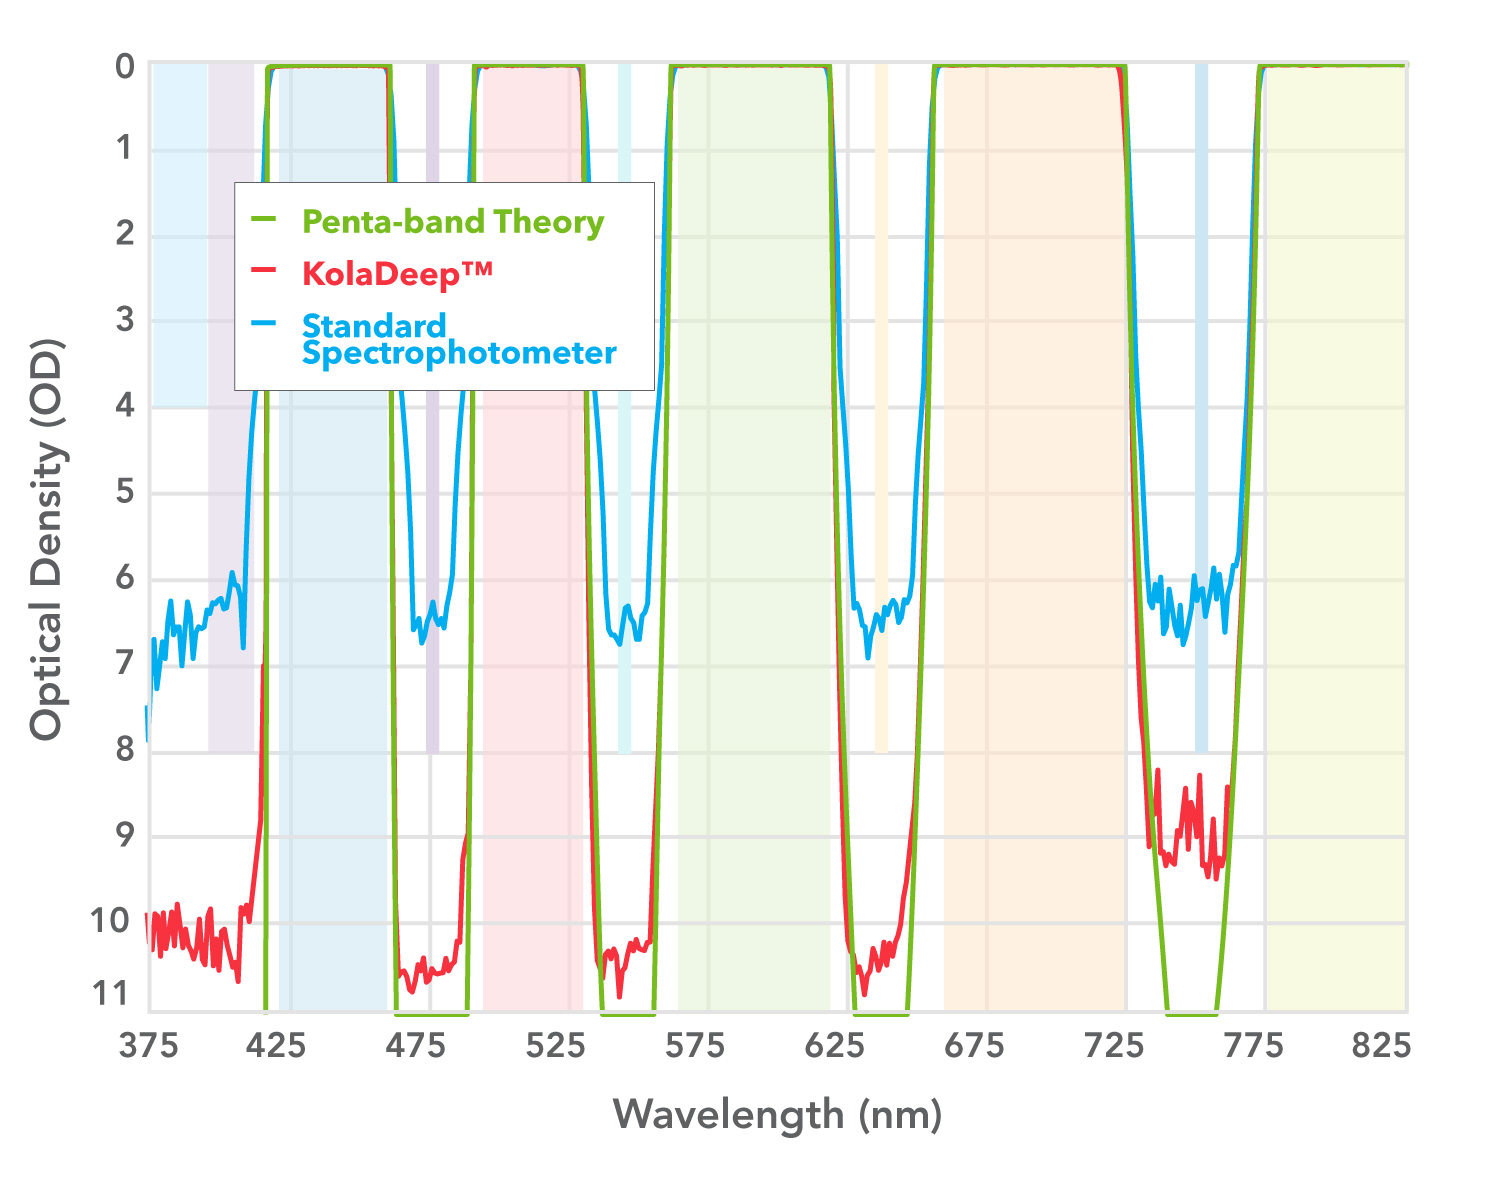
Figure 1: Spectral graph of OD vs. wavelength for a custom pentaband filter.
Measurement of deep blocking at the OD > 8 level not only guarantees that level of blocking to the filter user, but also confirms the underlying theoretical and practical manufacturing processes that target those deep blocking levels.
Figure 1 shows an example of blocking performance measurement for a custom penta-band filter. The blocking between passbands is specified to exceed OD 8 to prevent excitation light leakage. Theory and measurement agree to OD > 8, with some blocking reaching OD 9 or below, down to the noise floor. Data (blue) from a superior commercially available system are not accurate beyond OD 3 to 4 and cannot prove that the required OD blocking performance is met.
The KolaDeep SMS performs well over the UV and NIR spectral range, as seen in Figure 2 on measured data for the 280 nm and 1064 nm Semrock MaxLine® laser-line cleanup filters. Measurements with KolaDeep SMS (red trace) confirm the specified ODabs > 5 and ODabs > 6 blocking on both high and low wavelength regions and agree with the theoretical design (green trace) down to OD > 7. OD measurement (blue trace) on a superior commercially available system is seen to report inaccurately for OD > 3.
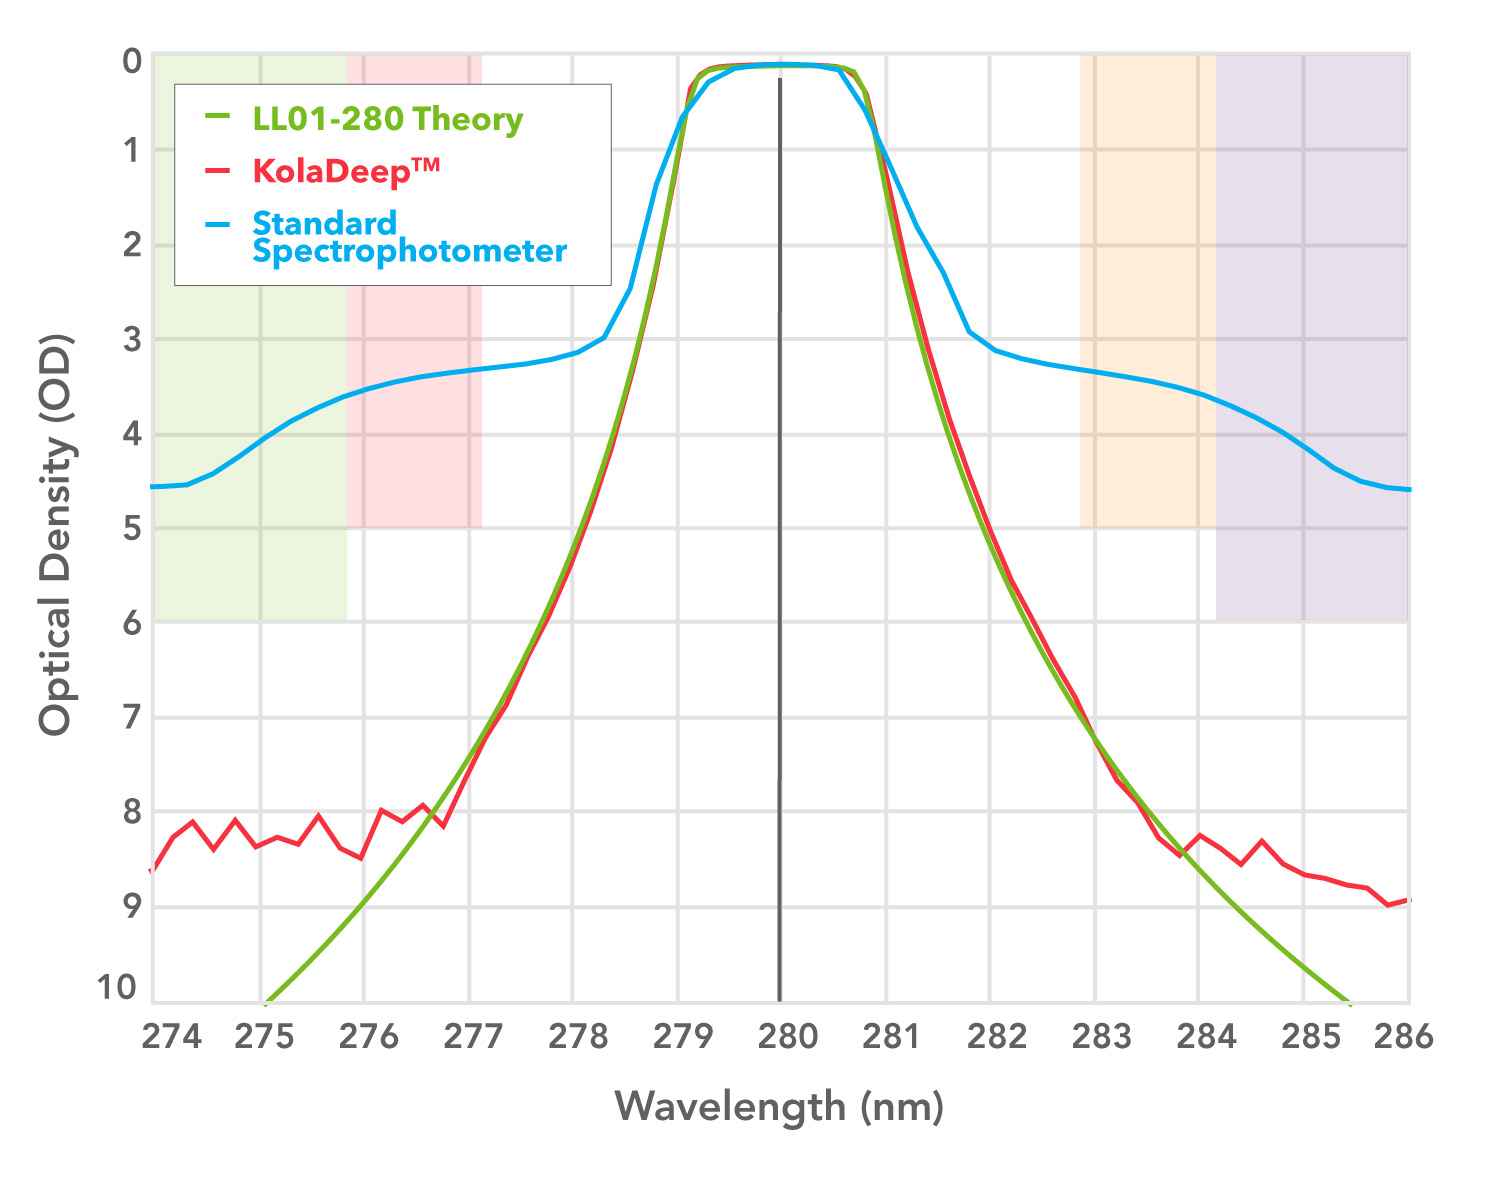
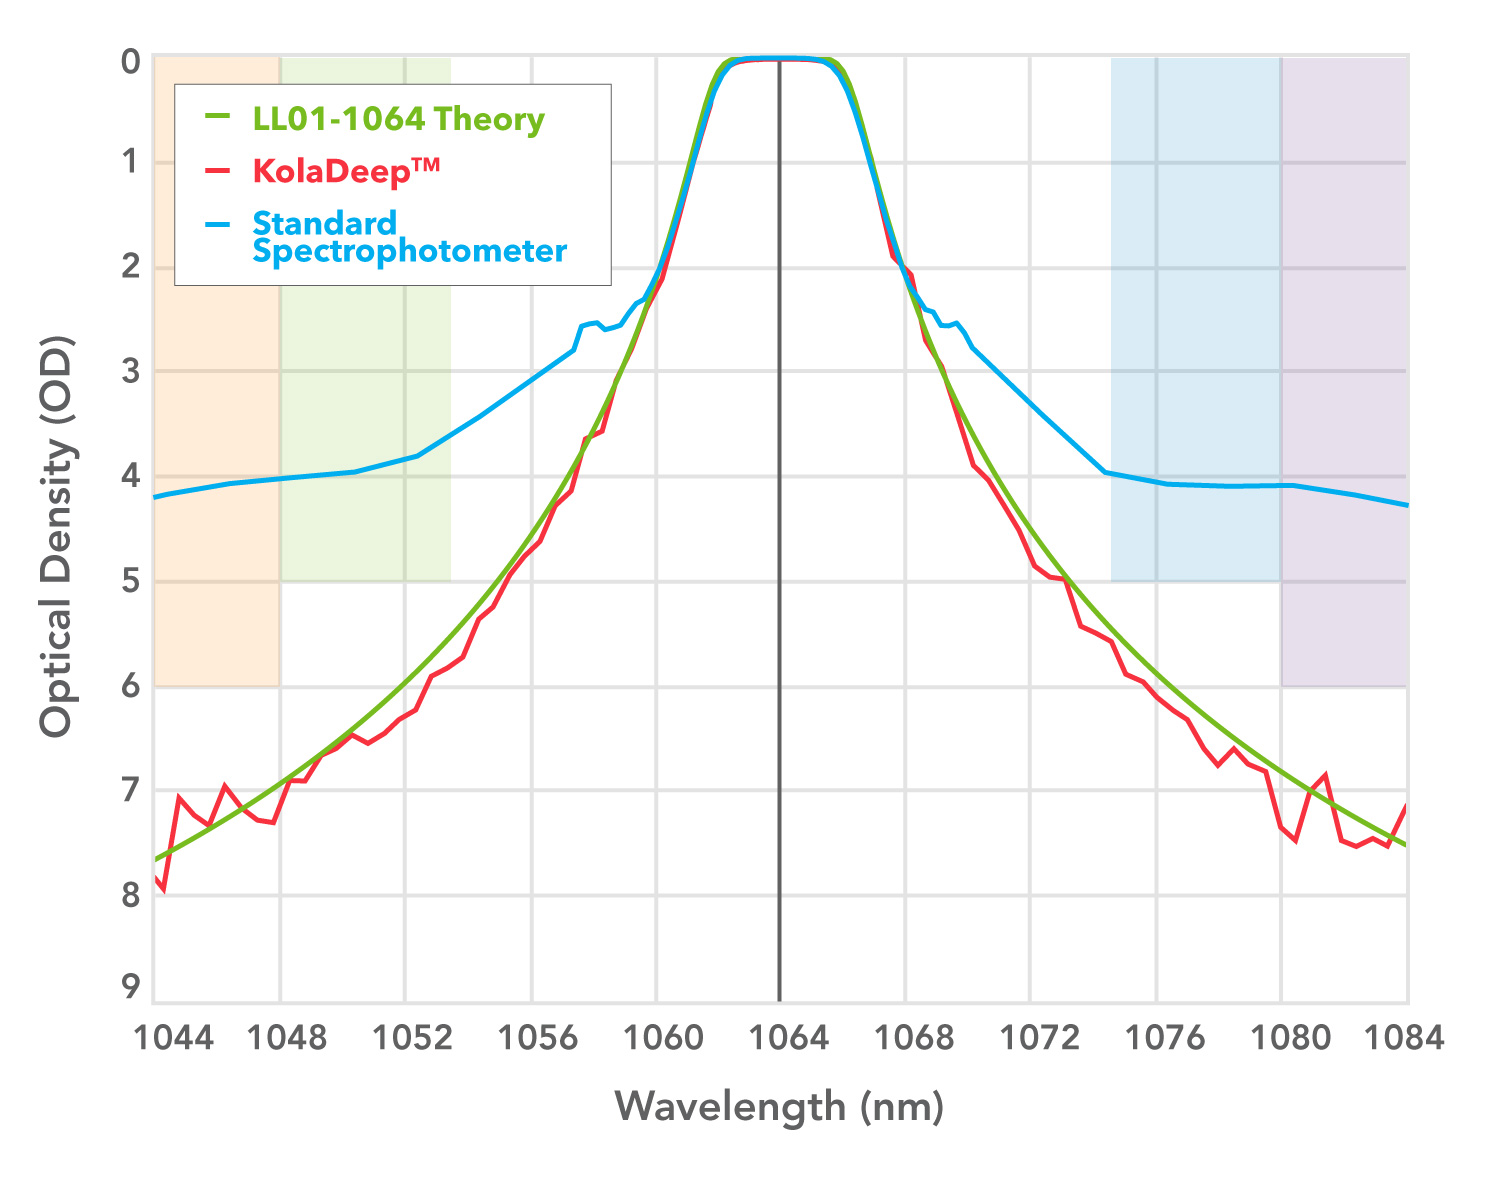
Figure 2. Spectral graph of OD vs. wavelength for Semrock MaxLine filters LL01-280 (left) and LL01-1064 (right).
Evaluating blocking in notch filters
Figure 3: Spectral graph of OD vs. wavelength for Semrock StopLine single-notch filter NF03-405.
Figure 3 shows the blocking performance measurement for a Semrock StopLine® single-notch filter, used to provide deep laser-line blocking with OD > 6 for maximum laser rejection. KolaDeep SMS data (red) confirms the specification is met and agree with design theory (green). The measurement with a standard spectrophotometer (blue) cannot prove that the filter meets the required deep blocking for the laser light at 405 nm.
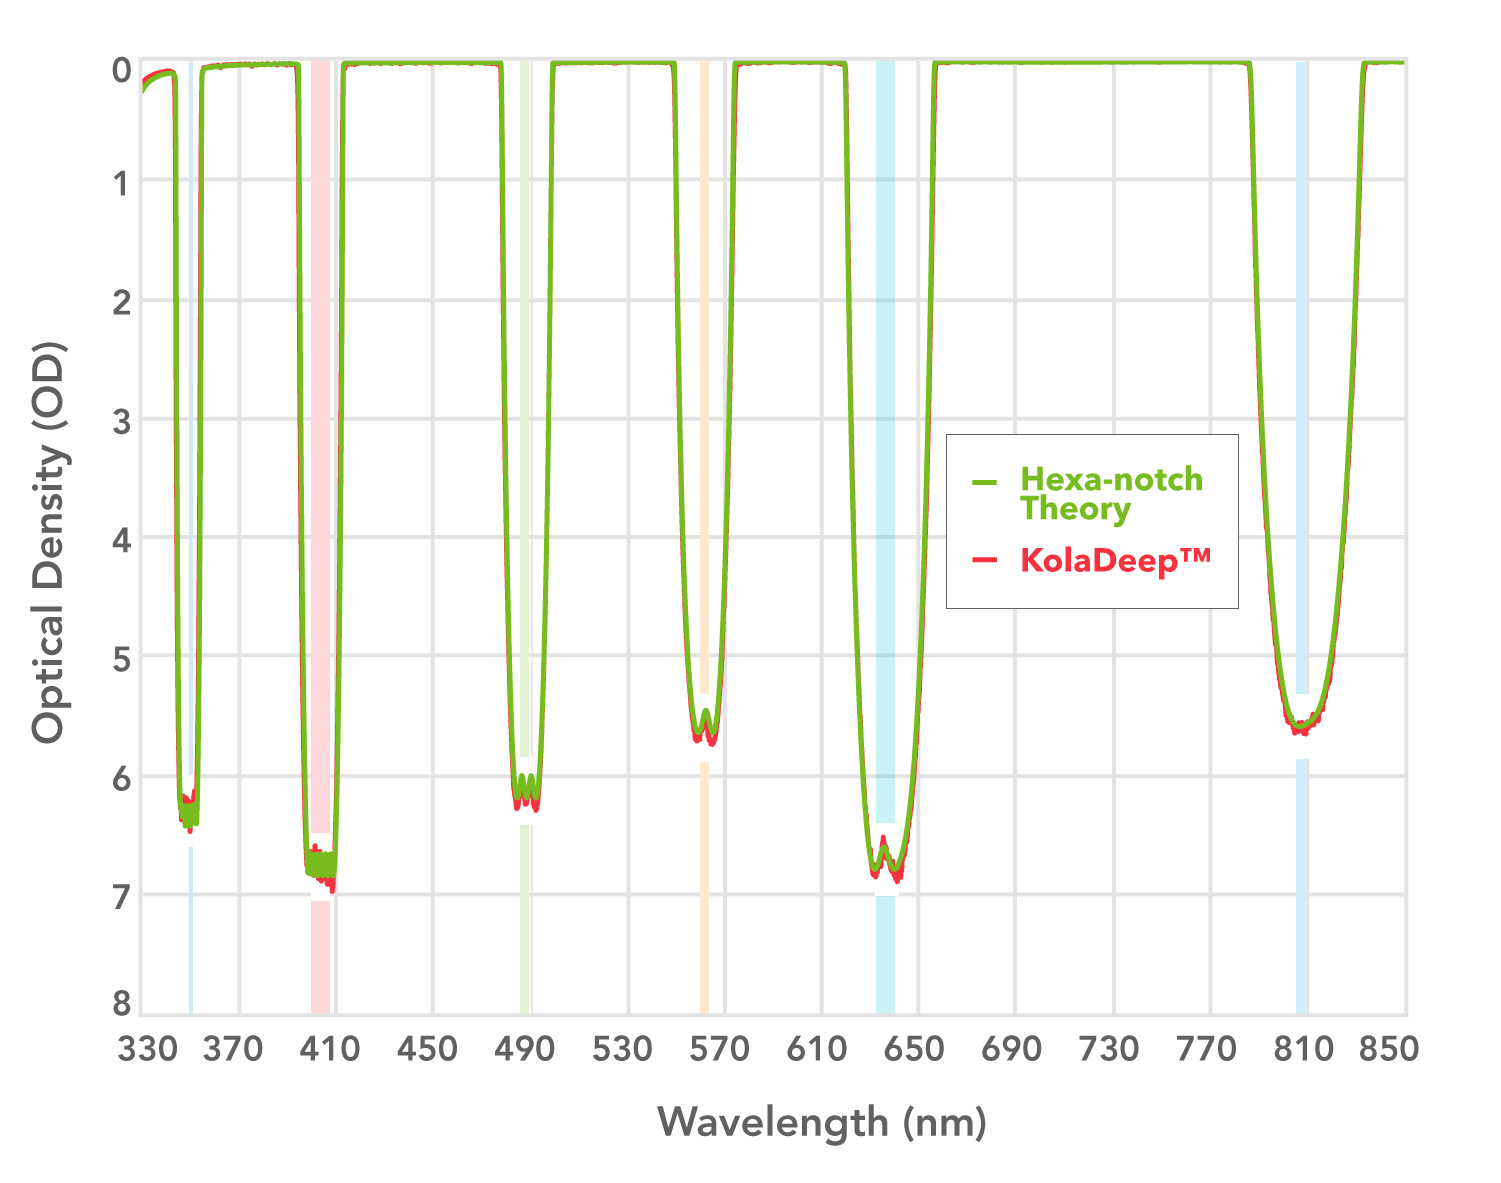
Figure 4: Spectral graph of OD vs. wavelength for a custom hexa-notch filter
Another example is shown in Figure 4 for a custom hexa-notch filter designed to ensure precise blocking for six laser lines. This customer required assurance that each laser line is repeatably blocked to a specific level. The spectra measured with KolaDeep SMS show precise matches to the specifications, even in the UV region. The measured blocking (red) again matches theory (green).
Resolving steep and deep edges of Raman filters
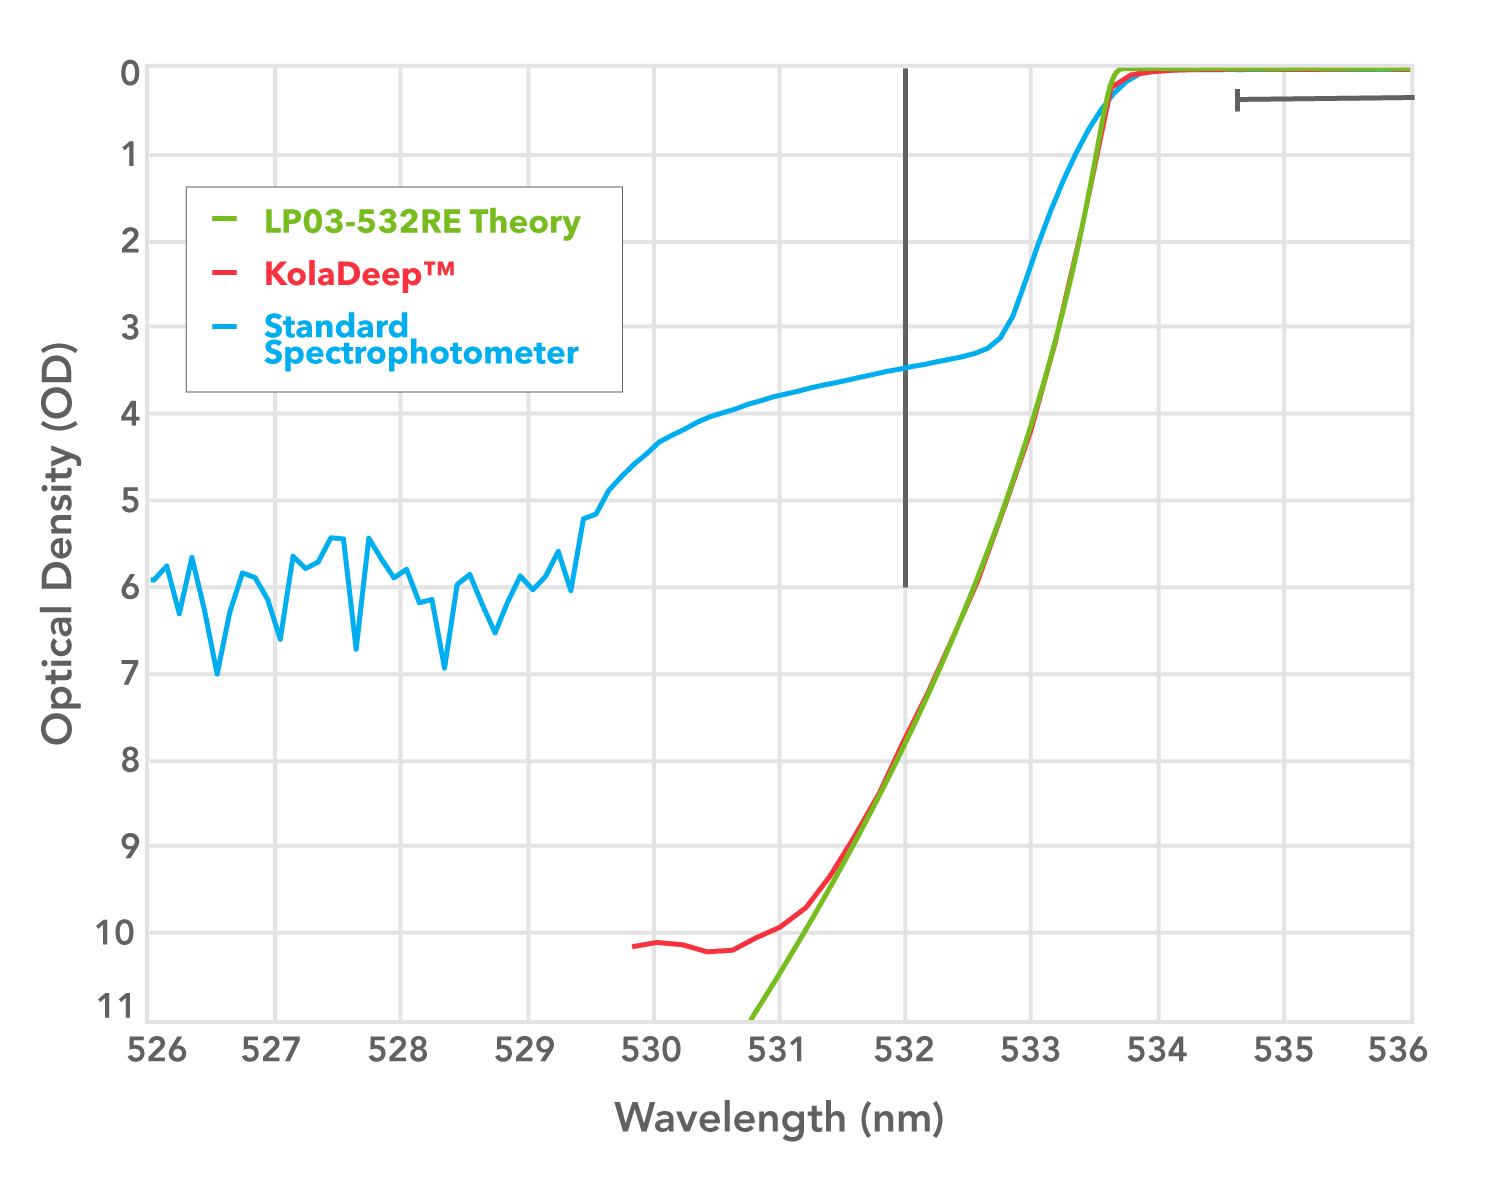
Figure 5: Spectral graph of OD vs. wavelength for Semrock RazorEdge filter LP03-532RE.
Long wave pass edge filters are frequently used in Raman instrumentation. They are designed with deep blocking at the laser line, typically with OD > 6 to eliminate bleedthrough of excitation light, and with a narrow transition width allowing measurement of very small Stokes shifts.
Transition Width (TW) and Edge Steepness (ES) are often used to describe the spectral properties of edge filters [2]. TW is the maximum wavelength distance between the laser line (where OD > 6) and the T = 50% wavelength. ES, the distance between the longest wavelength at which OD > 6 and the wavelength at which T = 50%, more usefully describes how quickly the filter transitions from blocking to transmission.
Measurements to resolve steep edges of these Raman edge filters inform the user as to the shortest wavelength at which useful signal can be collected, while assuring that laser light close to the passband is appropriately blocked.
Figure 5 shows an example of measurement on a Semrock RazorEdge® ultrasteep longpass edge filter, used to suppress the 532 nm laser line while collecting the signal close to the laser line in a Raman spectroscopy system. This filter is specified to meet OD > 6 at 532 nm with TW > 90 cm-1 (< 2.7 nm). Theoretical filter design data and KolaDeep SMS measurement agree, with OD > 8, ES = 0.2% (1.1 nm) from T = 90% to beyond OD 7, and very narrow TW (1.6 nm). On the other hand, measurement with a standard spectrophotometer (blue trace) is not sufficiently accurate to track the steep edge and demonstrate the blocking performance at the laser line.
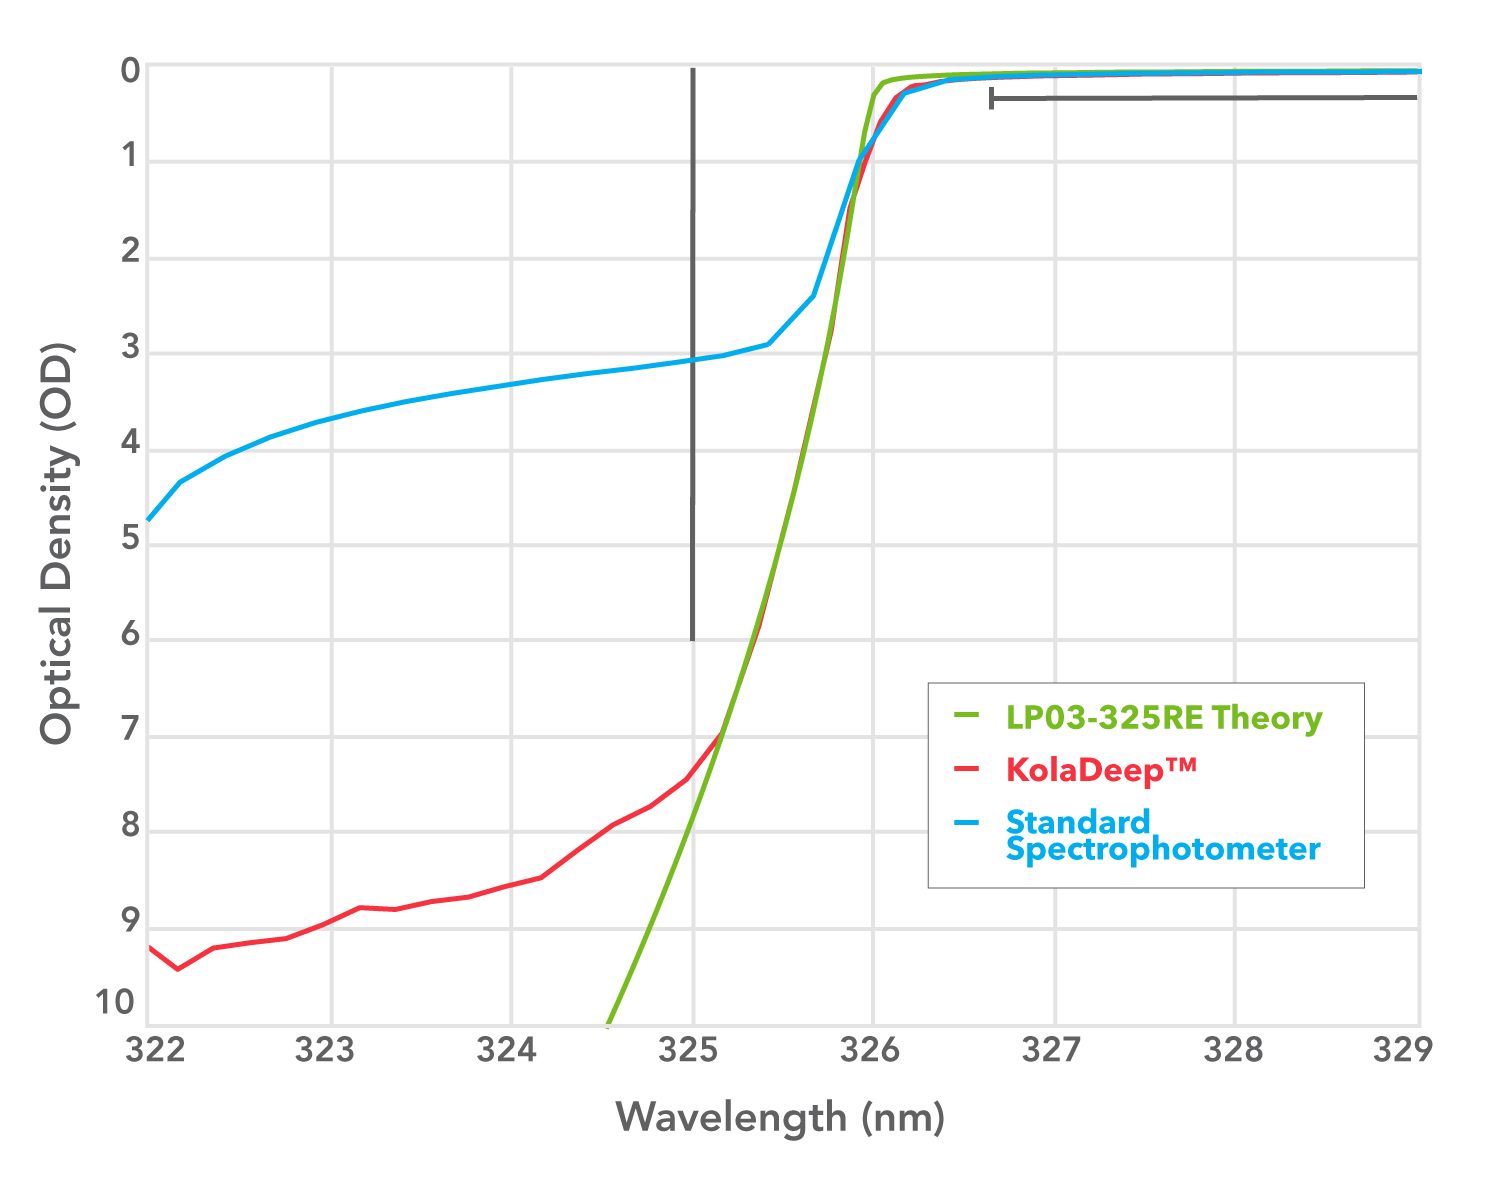
Figure 6: Spectral graph of OD vs. wavelength for Semrock RazorEdge filter LP03-325RE.
The KolaDeep SMS performs very well over the UV spectral range, as seen in Figure 6 for the 325 nm Semrock RazorEdge ultrasteep long-pass filter, for which deep blocking OD > 6 at the laser wavelength and a narrow transition width < 0.5% are again specified.
IDEX Health & Science recently introduced the Semrock Verona™ (VLP) series of long-pass edge filters for Raman spectroscopy. Besides being designed for OD > 6 at the laser line, they have a much smaller transition width than the Semrock RazorEdge series, for signal collection much closer to the laser line. Despite the additional challenge to measure these steeper edges, Figure 7 proves that both blocking and transition width specifications are met.
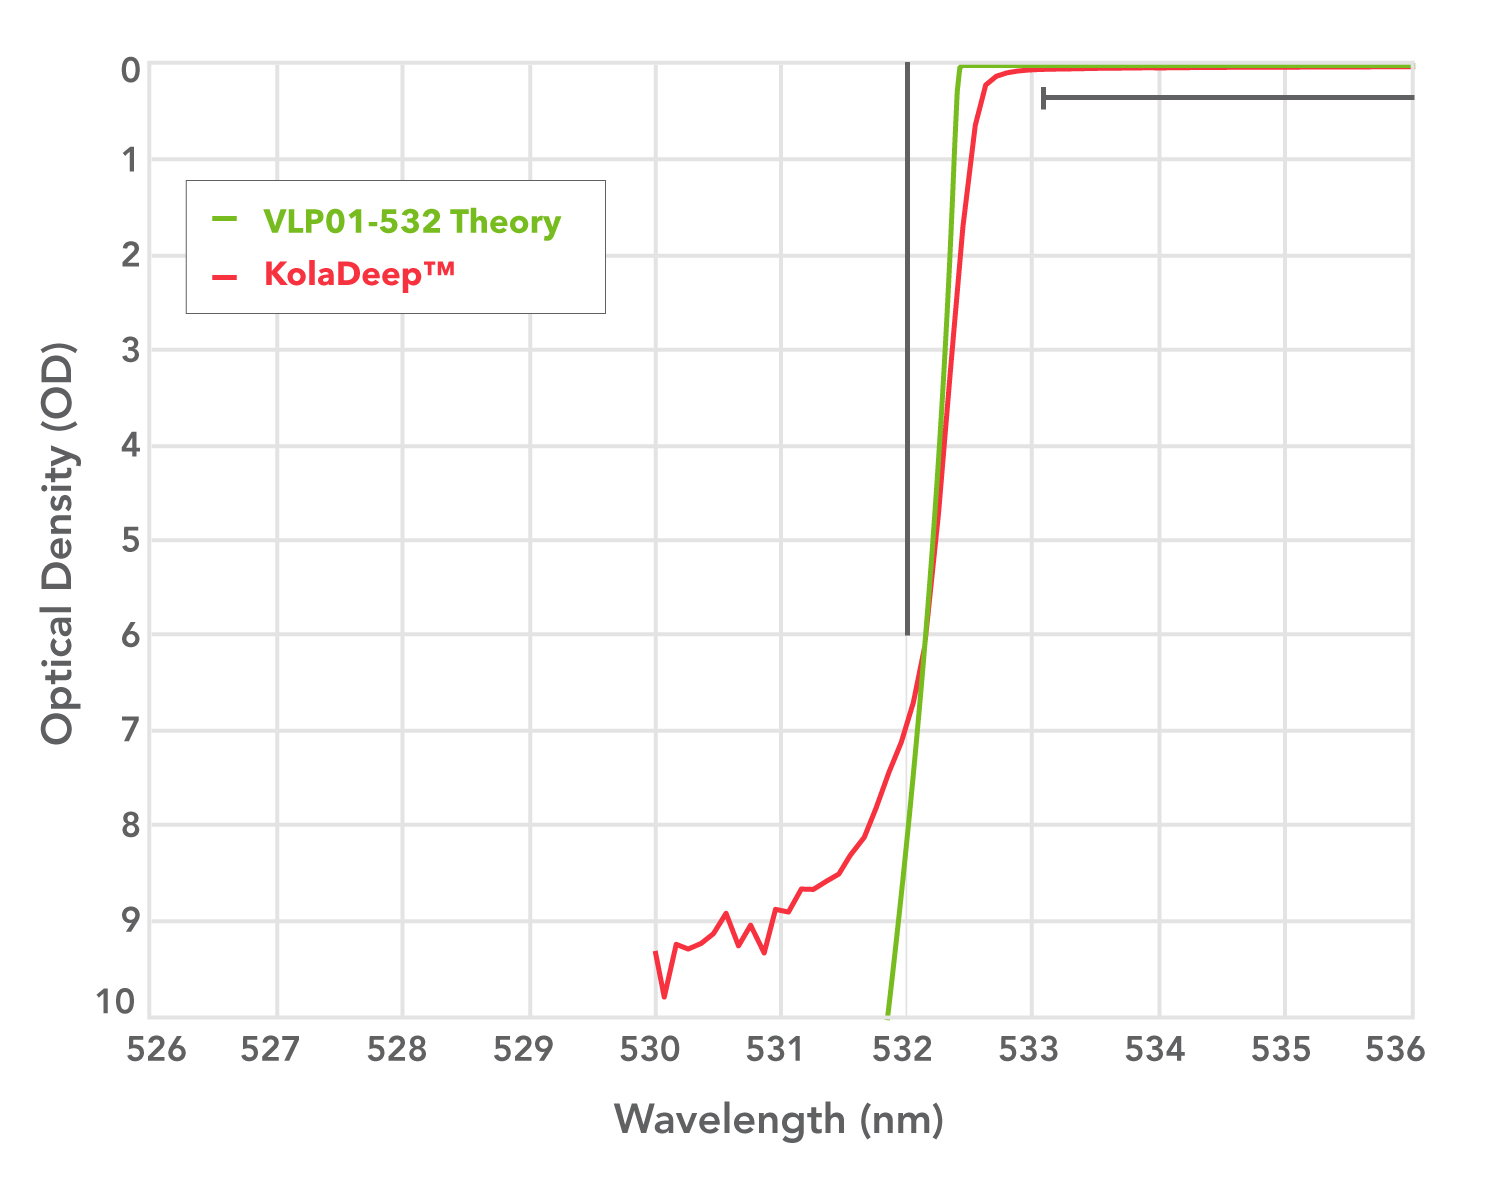
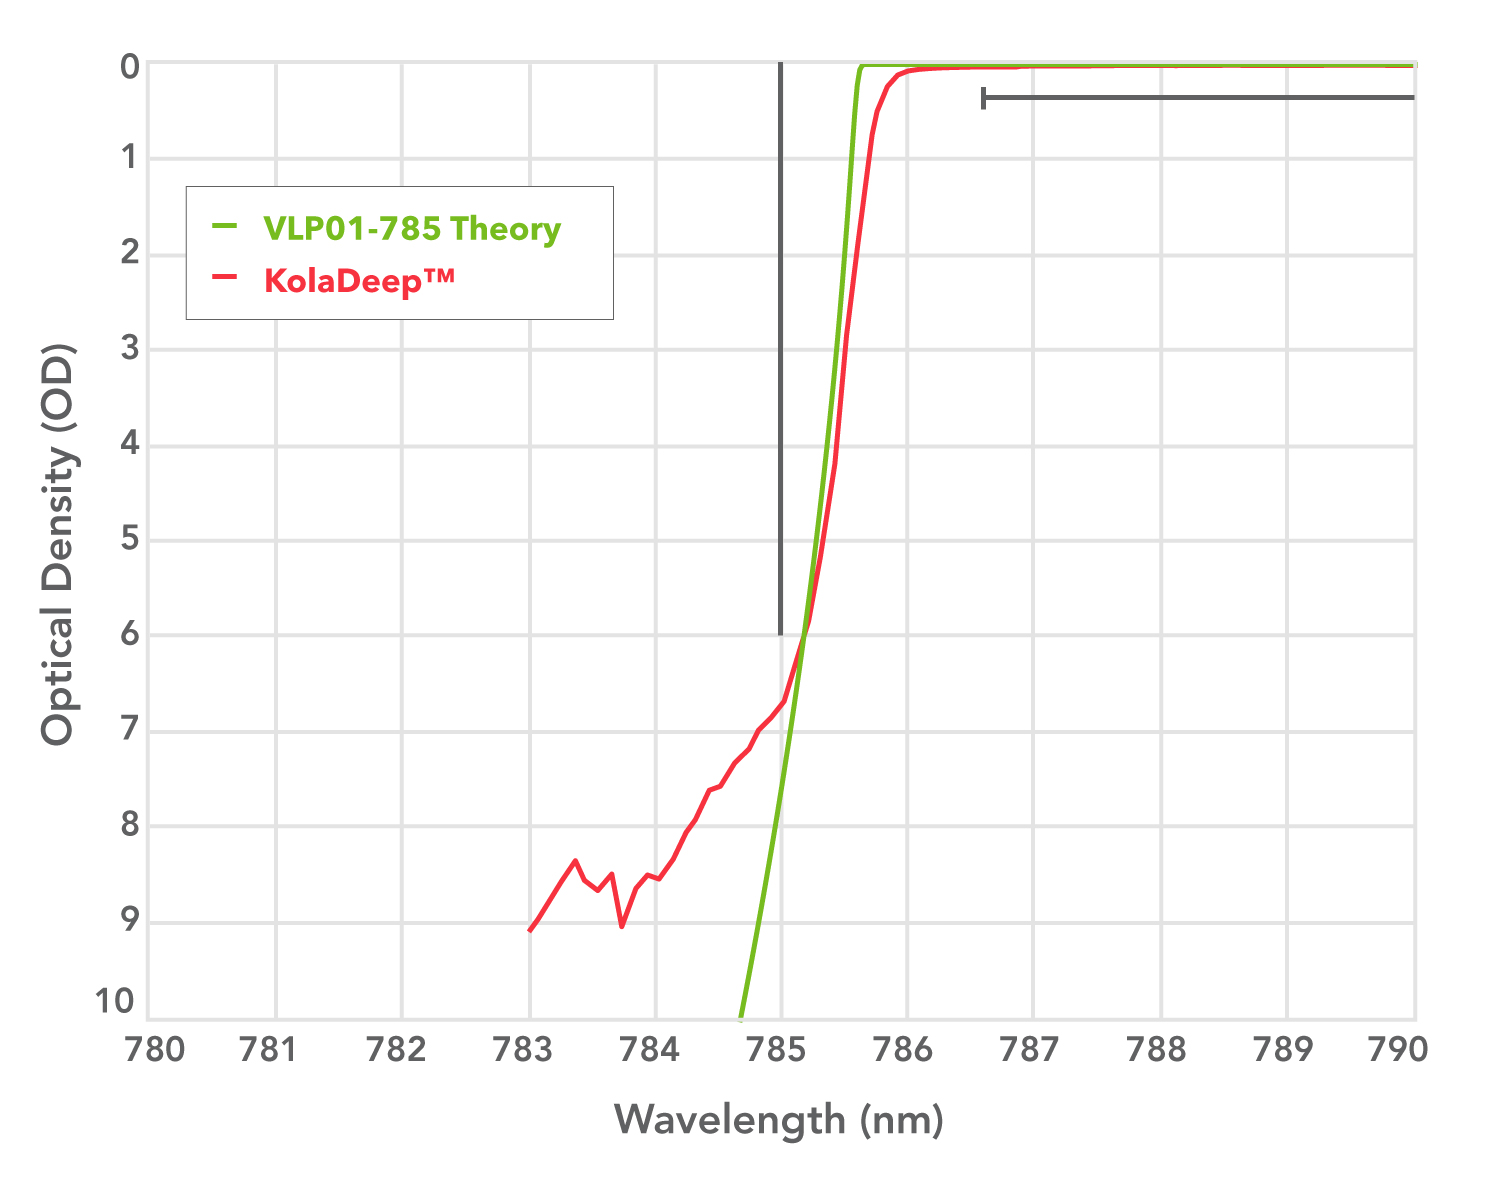
Figure 7. Spectral graphs of OD vs. wavelength for Semrock Verona filters VLP01-532 (left) and VLP01-785 (right).
For the VLP01-785, specified with TW < 1.6 nm, the KolaDeep SMS measures edge steepness ES = 0.63 nm (0.081%) from T = 50% to OD 6, TW = 0.81 nm, and OD > 6.7 at the 785 nm laser wavelength. The measurement is close to the design value of ES = 0.42 nm (0.053%), the difference being due to manufacturing tolerances and performance limitations of the KolaDeep SMS.
The VLP01-532 is similarly specified with TW < 1.1 nm; the KolaDeep SMS finds ES down to 0.45 nm (0.085%), TW to 0.6 nm (0.11%), and OD > 6.9 at 532 nm, proving that the specifications are met.
Peregrine SMS
This section begins with a simplified description of a standard spectrophotometer system for use in measuring optical filters and describes deleterious effects on measurement accuracy that can arise when using such devices for measurement of filters with deep blocking and steep edges. The following section describes how these limitations are overcome in the Peregrine SMS.
Limitations of commercially available spectrophotometers
The spectral performance of optical filters is not infrequently measured on commercially available spectrophotometers. Such instruments may come with limitations that include limited sensitivity and a probe beam that is both too large and imperfect with respect to collimation and monochromaticity. Three main discrepancies between the actual filter spectrum and its measured spectrum arise from these limitations (see Figure 8).
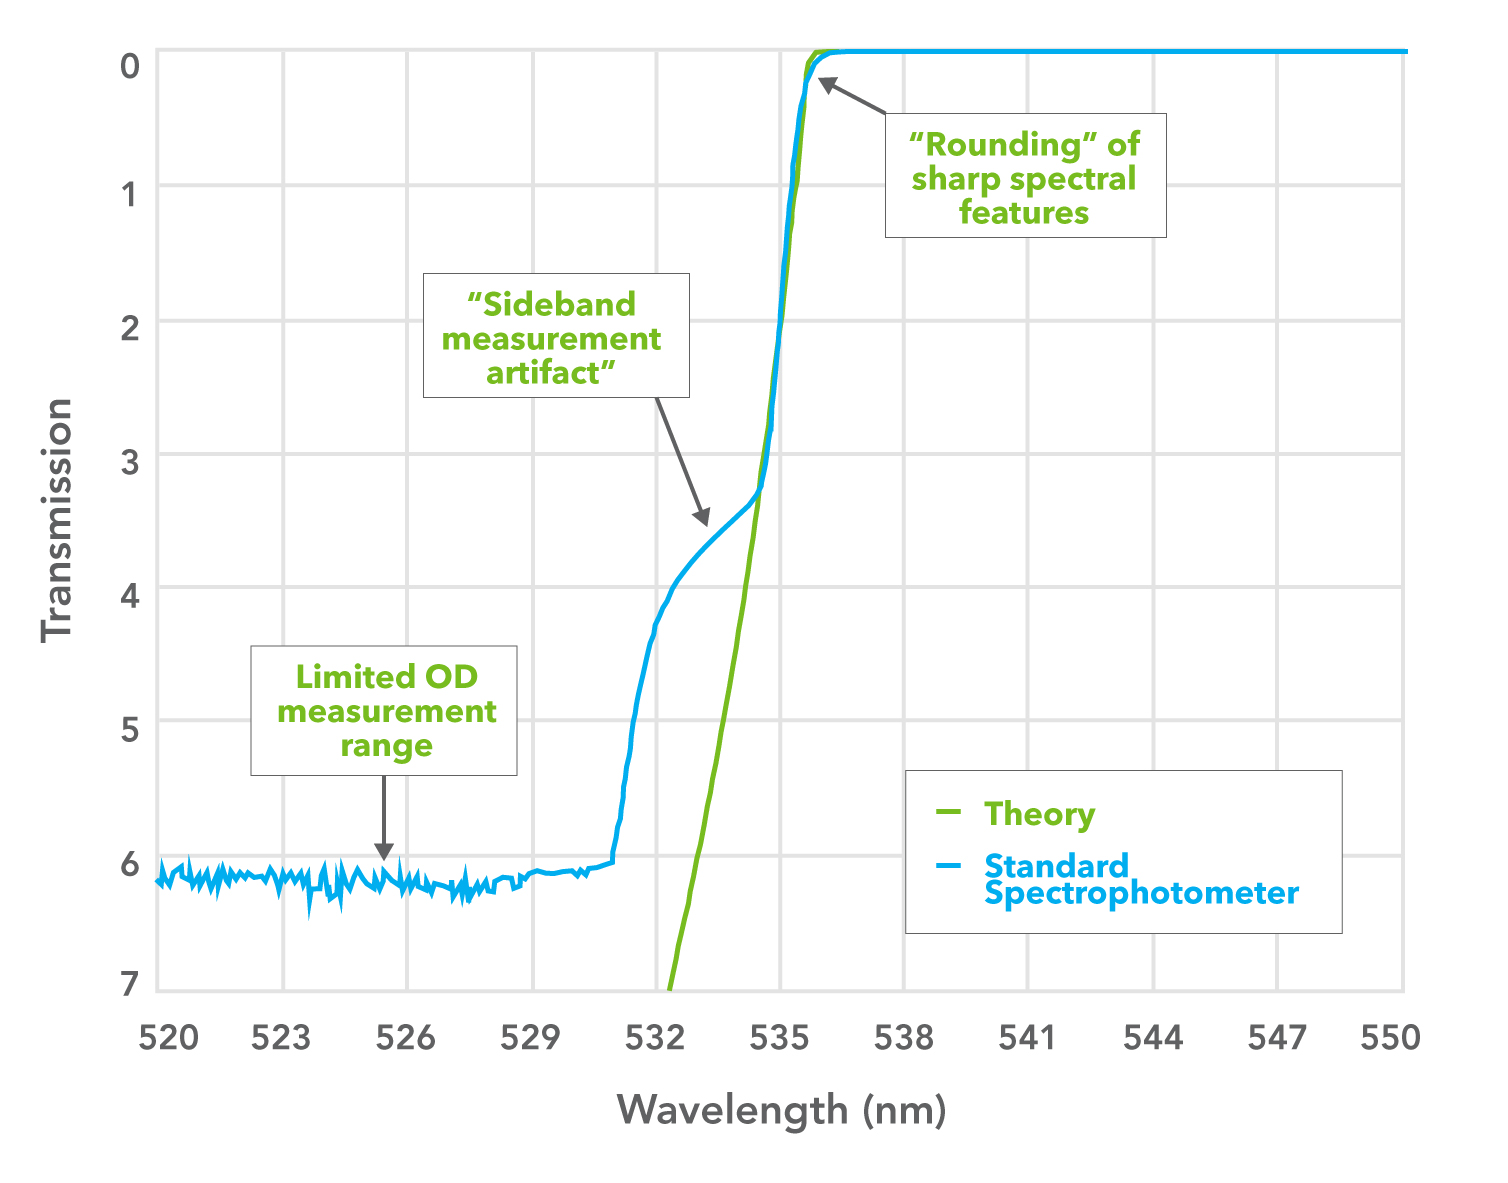
Figure 8: Measurement artifacts observed using a commercial spectrophotometer.
- Limited blocking (OD) measurement range due to the limited sensitivity of the spectrophotometer, i.e., the noise floor
- “Rounding” of sharp spectral features in commercial spectrophotometers, caused by non-zero bandwidth of the probe beam which limits spectral resolution, relatively large cone half-angle (CHA), large probe beam size, and probe beam contamination by scattering from rulings on the diffraction grating that is especially apparent on steep spectral edges
- “Sideband measurement artifact,” specific to measurements of very steep transitions from high blocking to high transmission, that arises from the non-monochromatic probe beam.
The operating principle of a typical spectrophotometer is illustrated in Figure 9. A monochromator contains a diffraction grating to disperse light from a broadband source into a range of angles and uses an adjustable slit to select a narrow band of wavelengths. This quasi-monochromatic probe beam is directed toward the sample (test) filter. In a dual-beam spectrophotometer (as shown), either a beam-splitter is used to split the probe beam into reference and measurement beams, or the light is alternated in time between the reference and measurement paths at a suitably high rate. The reference beam goes directly to the detector, though it might be attenuated with a calibrated neutral density filter depending on the blocking level of the sample filter. The measurement beam passes through the sample filter and to the detector. The filter transmission value is established from the ratio of the signals from the two beams as the wavelength is scanned over a broad range.
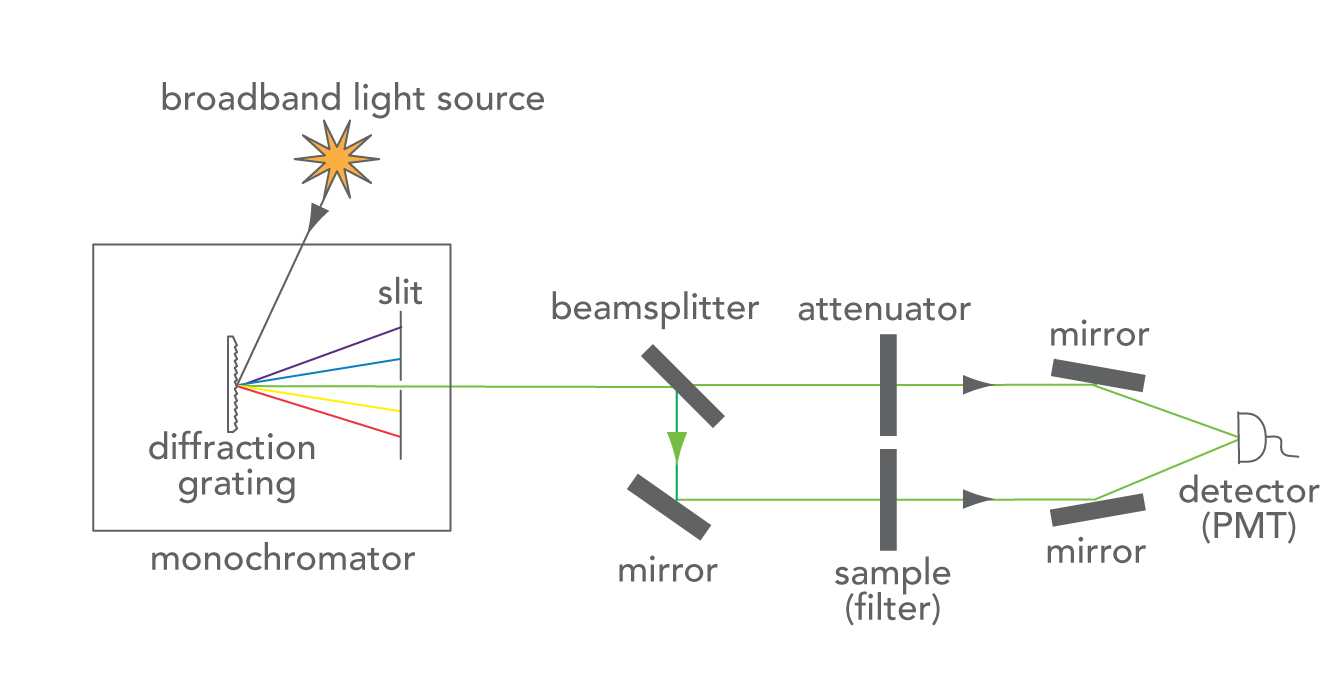
Figure 9: Simplified diagram showing the main elements of a dual-beam spectrophotometer.
An actual spectrophotometer has a more complex system of optics and electronics to avoid measurement errors due to alignment issues, imperfect components, scattered light, and other noise sources. Despite having such improved instrumentation, the critical features of high-performance optical filters with steep edges and/or deep blocking cannot be accurately measured by these spectrophotometers, as described above.
The first discrepancy described above, limited blocking (OD) measurement range, is a result of the limited sensitivity of the spectrophotometer. When a filter has high OD (e.g., > 6), very little light reaches the detector, and optical and electronic noise at the detector limit the lowest signal that can be measured accurately. The signature of this artifact is a flat, noisy spectrum that appears to be “pinned” to a certain OD value, although the actual filter OD may be substantially higher than the represented value. This signal limit is often called the “noise floor,” and can be wavelength dependent due to variations in the light source and detector response spectra. Note that the noise floor can be decreased, allowing for higher OD measurements, by widening the monochromator slits and letting more light through the system, but this increased sensitivity must be traded off against poorer spectral resolution. This is therefore not an option when measuring steep edges down to deep blocking.
The second measurement discrepancy is the “rounding” of sharp spectral features. This is a result of the non-zero bandwidth of the spectrophotometer probe beam. The minimum bandwidth is limited by the slit width and the number of grating periods encountered by the light beam; the larger the area of the diffraction grating (for a given number of lines per mm), the higher the resolution. For a given f/# (Cone Angle), a larger grating area also requires a longer path length and thus a larger instrument.
Spectral resolution can also be increased by reducing the slit width, but a narrower slit reduces the amount of light passing through the monochromator to the detector, and therefore reduces the sensitivity.
This “rounding” in commercial spectrophotometers can also result from a significantly large cone half-angle (CHA) and from a large probe beam size. This effect of beam CHA is particularly significant when measuring steep edges of spectrally complex interference filters at high AOI, such as 45°, because of the greater spectral shift with AOI. The measurement of the spectrum of such filters is significantly degraded by a large CHA, typically near 3° in commercial spectrophotometers. Finally, a large probe beam can also round off the steep edges, since the measurement is averaged over a larger area over which the location of the spectral features can vary.
The third discrepancy is unique to measurements of very steep transitions from high blocking to high transmission and is referred to as a “sideband measurement artifact.” It often takes the form of a “kink” in the edge spectrum when plotted in OD units, usually occurring in the range of about OD 2.5 to 4.5, depending on the spectrophotometer and wavelength. This artifact arises from the non-monochromatic probe beam: in addition to the non-zero bandwidth of the probe beam, it also has weak sidebands at wavelengths outside its bandwidth that arise principally from imperfections in the grating and from scattered light. When the probe beam is located at a wavelength on a very steep edge, instead of being attenuated at the OD level of the filter, sideband noise on one side of the probe wavelength is transmitted by the filter within its passband. This results in a larger signal on the detector and leads to a lower OD reading than the actual. In a commercial instrument, there is little one can do to reduce this sideband artifact except to add additional filtering. Inference is therefore required, based on the theoretical transmission characteristic and knowledge of the instrument as designed, to extrapolate the behavior from lower OD values to estimate the edge spectrum at high OD values. In any case, it is not possible to immediately determine whether the filter achieves OD > 6 just by referring to the measured data.
These measurement discrepancies cause significant problems when trying to assess the performance of high-performance filters, especially to measure critical features such as steep edges and/or deep blocking. However, an optical spectrophotometer system can also be improved so that inherently better measurements are possible, either through enhancements to commercial instruments or by development of fully customized spectrophotometers [3], [4].
Peregrine SMS custom design
IDEX Health & Science utilizes several measurement methods and systems to evaluate different filters at different stages of the manufacturing cycle to varying degrees of accuracy as required. The Peregrine SMS has been and remains a key part of the IDEX Health & Science metrology equipment, especially as it is now well complemented by the KolaDeep SMS. The Peregrine SMS is a proprietary spectrophotometer platform engineered to overcome some of the limitations of commercially available spectrophotometers, with superior spectral resolution and wavelength accuracy, a low CHA of 0.3° and small probe beam size, as well as precise AOI adjustment from 0° to 60° with measurement for both polarizations. This fully adjustable metrology platform allows for fast, robust, and accurate spectral measurements. It is capable of high spectral resolution to resolve sharp features, as well as high OD measurement capability to OD 6.5 between 320 and 1120 nm, and to OD 5.5 outside this range.
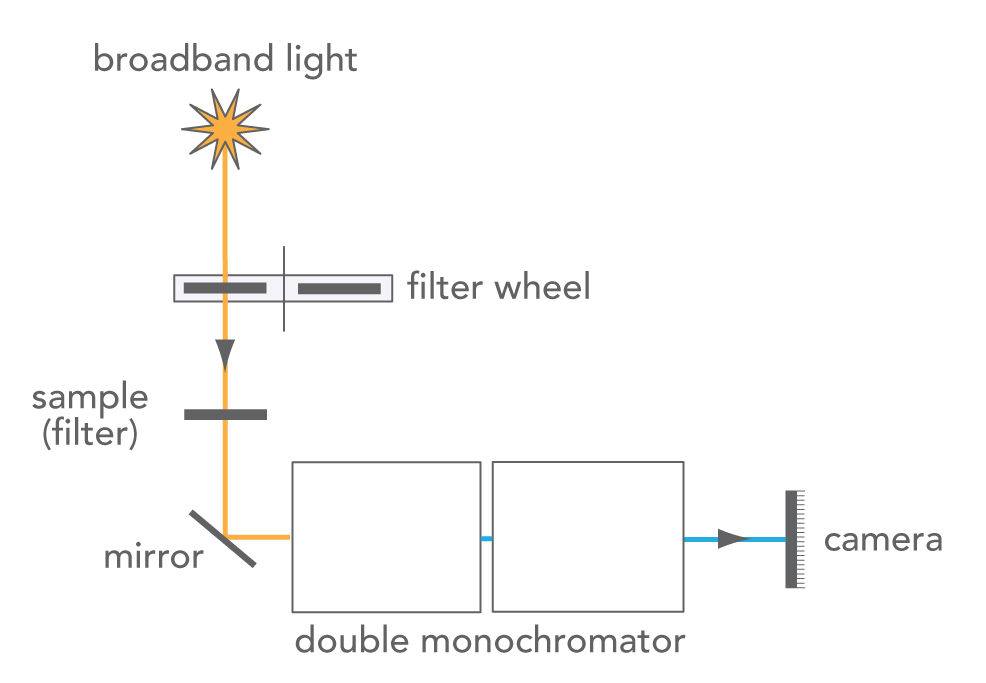
Figure 10: Basic layout of the Peregrine SMS based on broadband illumination of the test filter and collection of a broad range of wavelengths simultaneously with a detector array.
The layout of the Peregrine SMS is summarized in Figure 10. The primary difference between this instrument and a standard commercial spectrophotometer is that detection in the custom-built system uses a low-noise CMOS camera (i.e., detector array) capable of measuring a wide range of wavelengths simultaneously, rather than measuring each wavelength data point sequentially as the grating angle is scanned. The main advantage of this approach is that it is much faster; a broad spectral measurement at a given resolution and with a given integration time (and resulting noise floor) can be made much more rapidly.
One might ask why all spectrophotometers don’t utilize this principle since it offers significant speed advantages. Note that the approach of the custom-built spectrophotometer requires the test sample to be illuminated with broadband light, so that a broad range of wavelengths can be captured simultaneously by the detector array. Illumination with broadband light does not pose any significant problems when the test sample is a glass optical filter but could pose problems if the sample emits significant autofluorescence, for example, which could interfere with an accurate measurement of only the transmission through such a sample.
Because commercial spectrophotometers are designed to work with a wide range of possible test samples, including those that are very sensitive to broadband illumination or emit autofluorescence, it is preferable to probe the sample with quasi-monochromatic light in these instruments. The custom-built spectrophotometer does use some additional filtering of the light source prior to the test filter (see the filter wheel in Figure 10) to eliminate stray light and higher-order diffracted light from the grating downstream. The light transmitted through the test filter is transmitted through a double monochromator with a cooled, UV-enhanced CMOS camera to collect the light.
Measuring Steep Edges at High AOI
The Peregrine SMS was developed to measure steep edges of spectrally complex interference filters, even at high AOI such as 45°. For such filters the main limitation is due to the instrument probe beam CHA, which tends to limit the measured edge steepness. The Peregrine SMS probe beam has CHA < 0.3°, which is small enough to avoid significant rounding off.
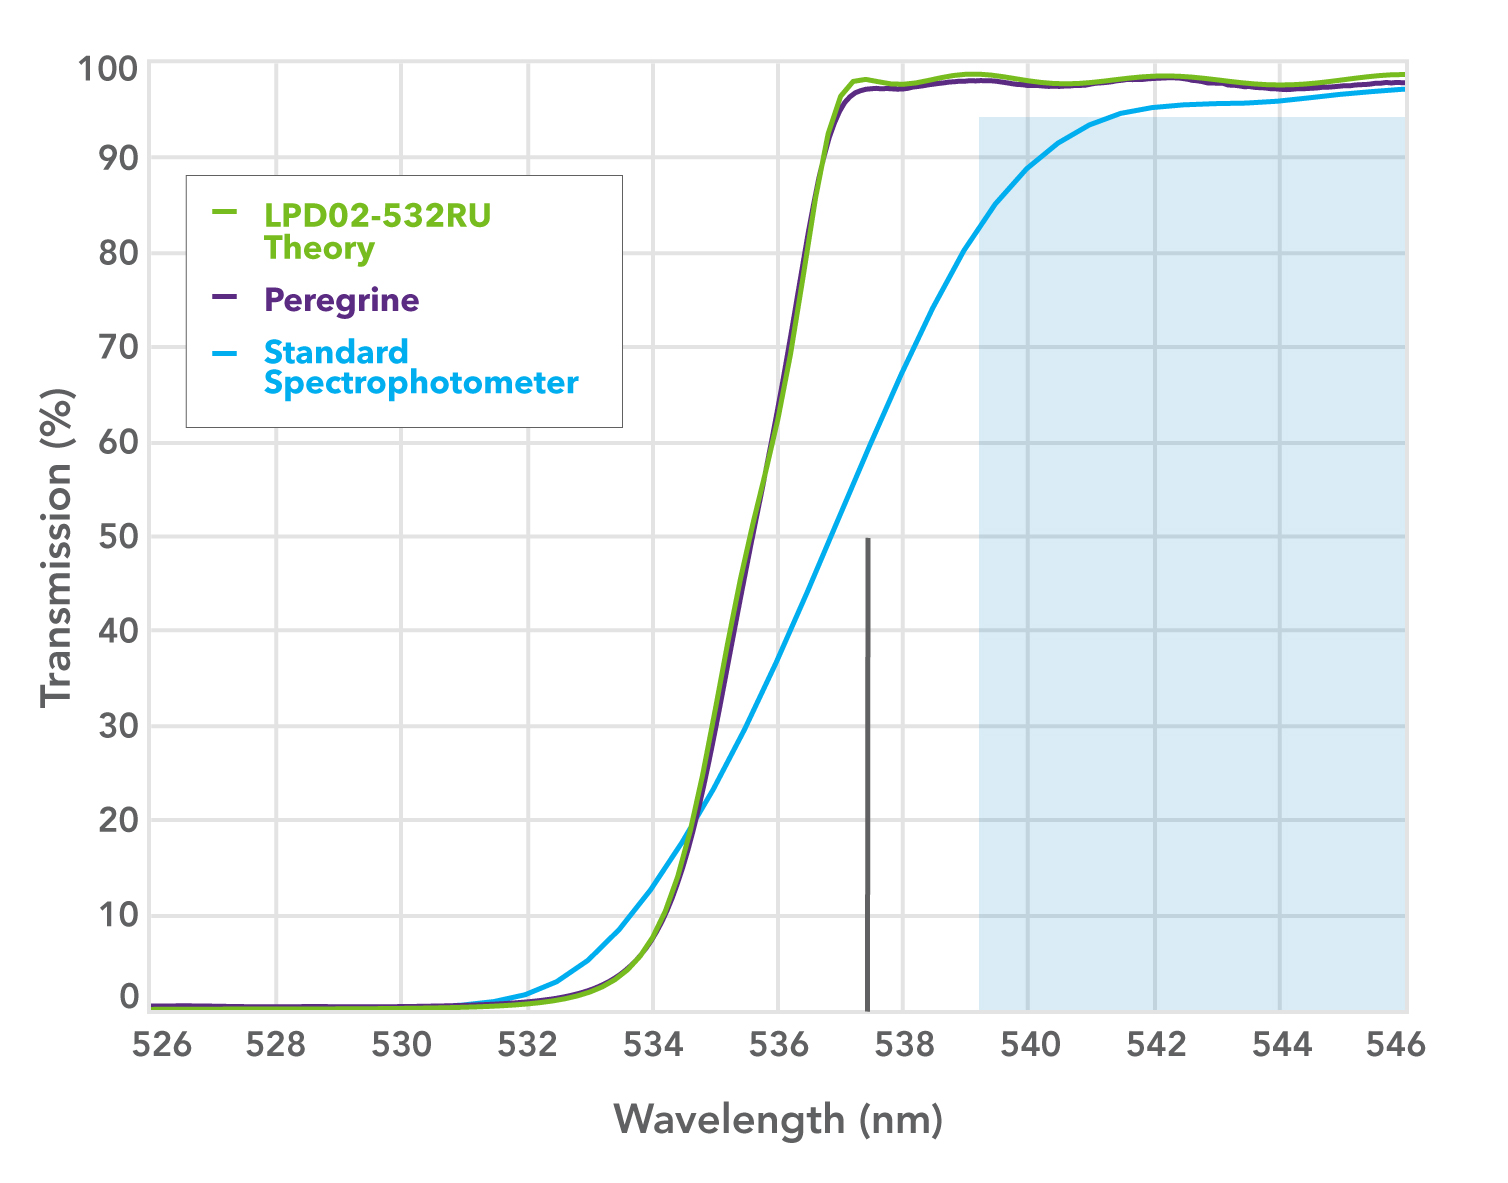
Figure 11: Spectral graph of transmission vs. wavelength for Semrock RazorEdge ultrasteep dichroic LPD02-532RU.
Figure 11 shows the measured transmission for a RazorEdge dichroic designed for ultrasteep transition from reflection to transmission, with TW < 1% of the laser wavelength and ES < 0.5% from T = 5% to 50%. The measurement with Peregrine SMS (purple) follows the edge, with the measured spectrum at 45° matching the theory (green). Measurement with a standard commercial spectrophotometer (blue) shows pronounced “rounding” of the edge and cannot be used to correctly assess the edge performance.
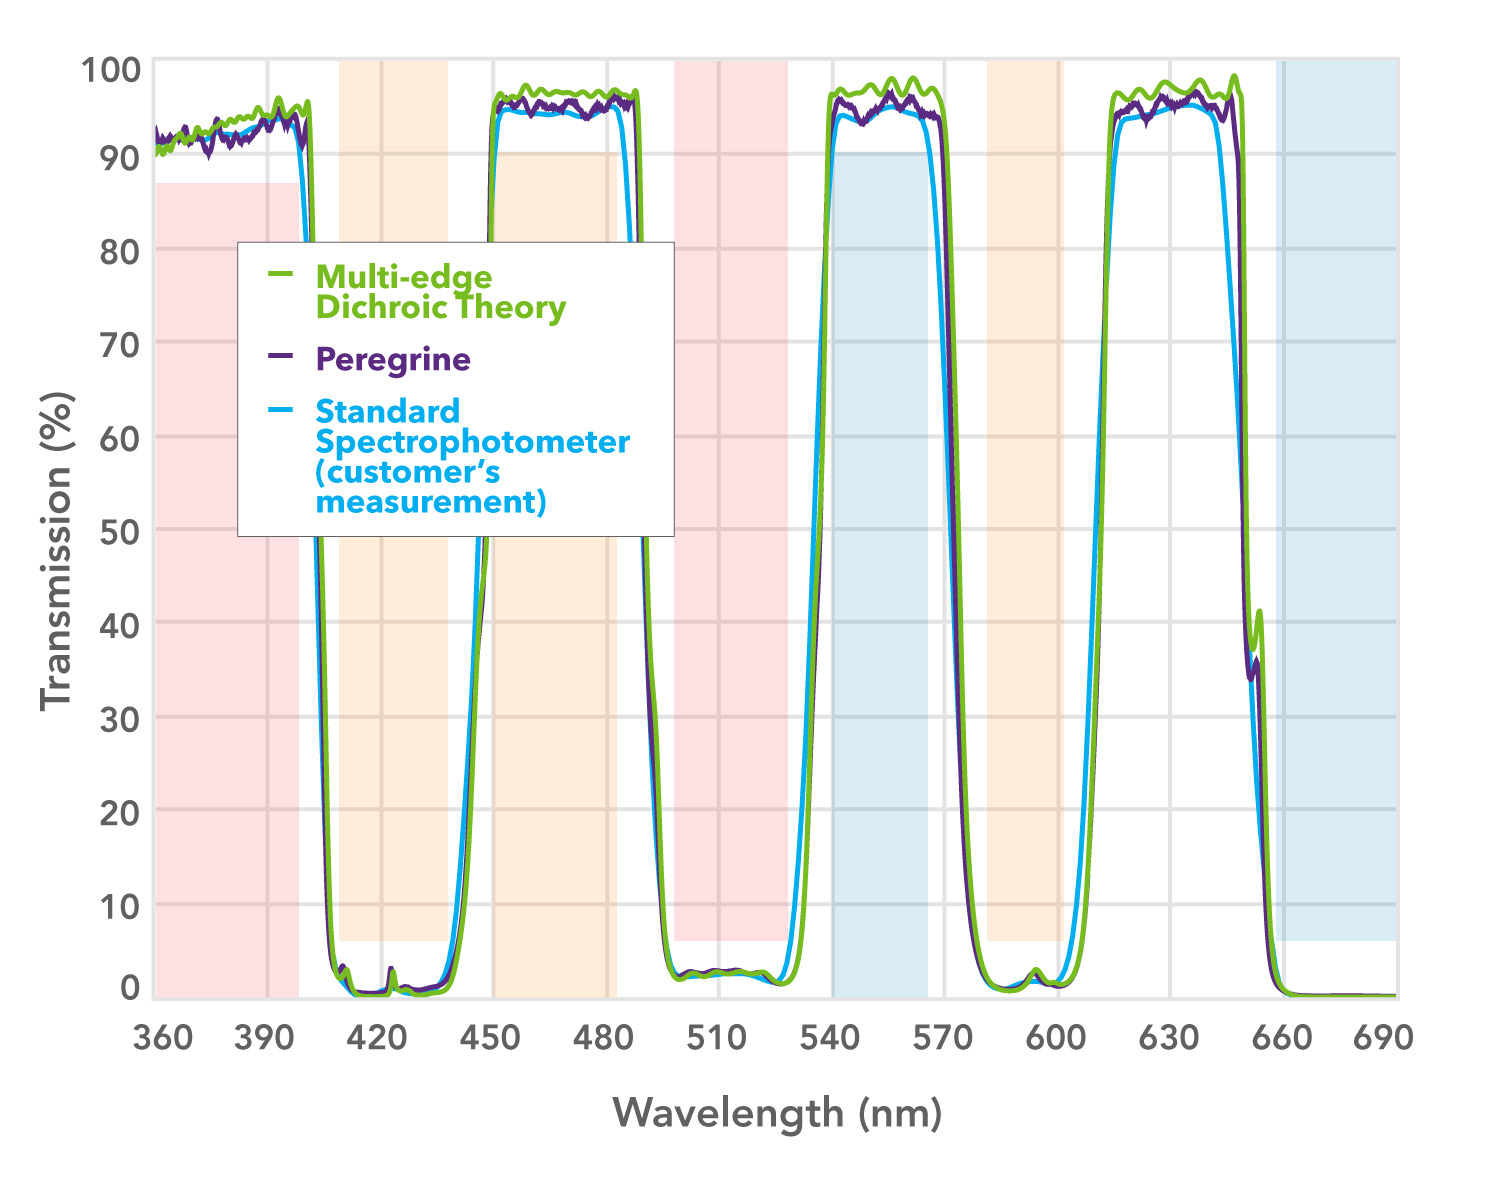
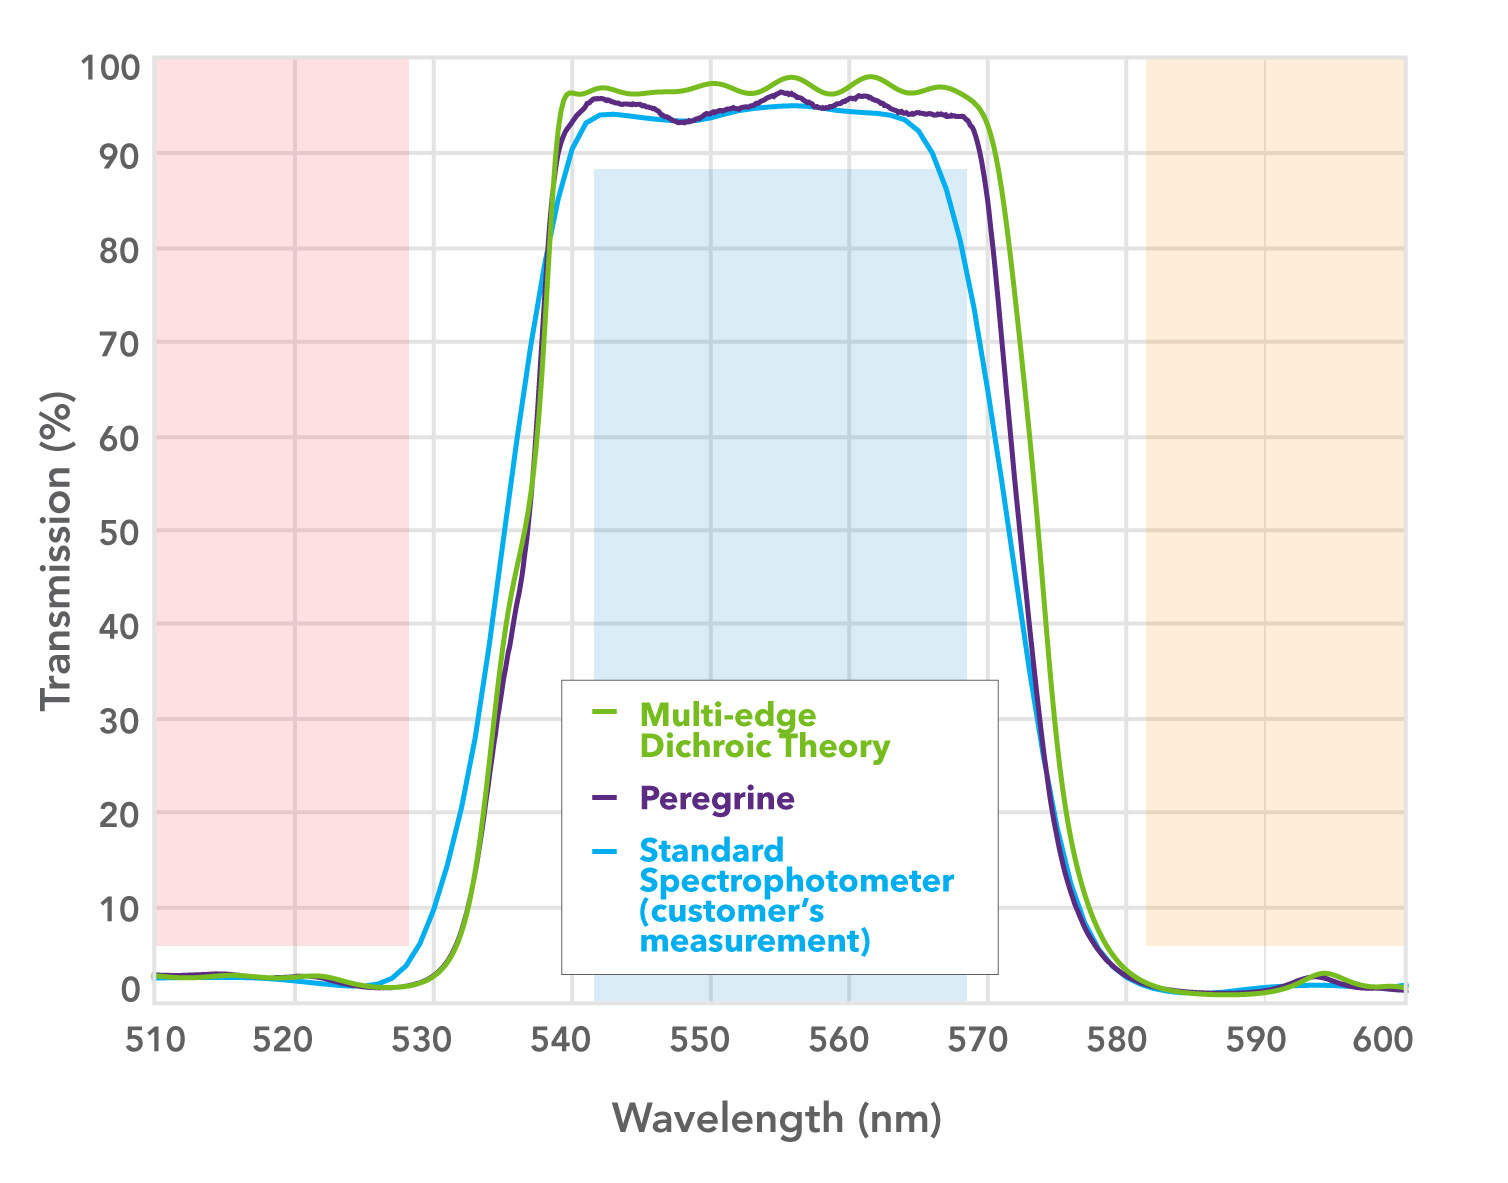
Figure 12. Left: Spectral graph of transmission vs. wavelength for a custom multi-edge dichroic. Right: Expanded view of the third passband showing the rounding of spectral features.
Figure 12 shows measurements of a custom multi-edge dichroic at AOI = 45° designed with steep edges to achieve both high transmission within the passbands and high reflection over the nearby reflection bands. The measured production data with Peregrine SMS (purple) and the theoretical data (green) again agree very well, confirming that the specifications for this product are met. The third trace (blue) shows the measurement with a commercial spectrophotometer, which cannot be used to prove that the absolute transmission specifications are met over the passbands, emphasizing the deleterious effect of CHA on the measurement of a steep-edged dichroic as described above.
Measuring steep edges with deep OD near normal incidence
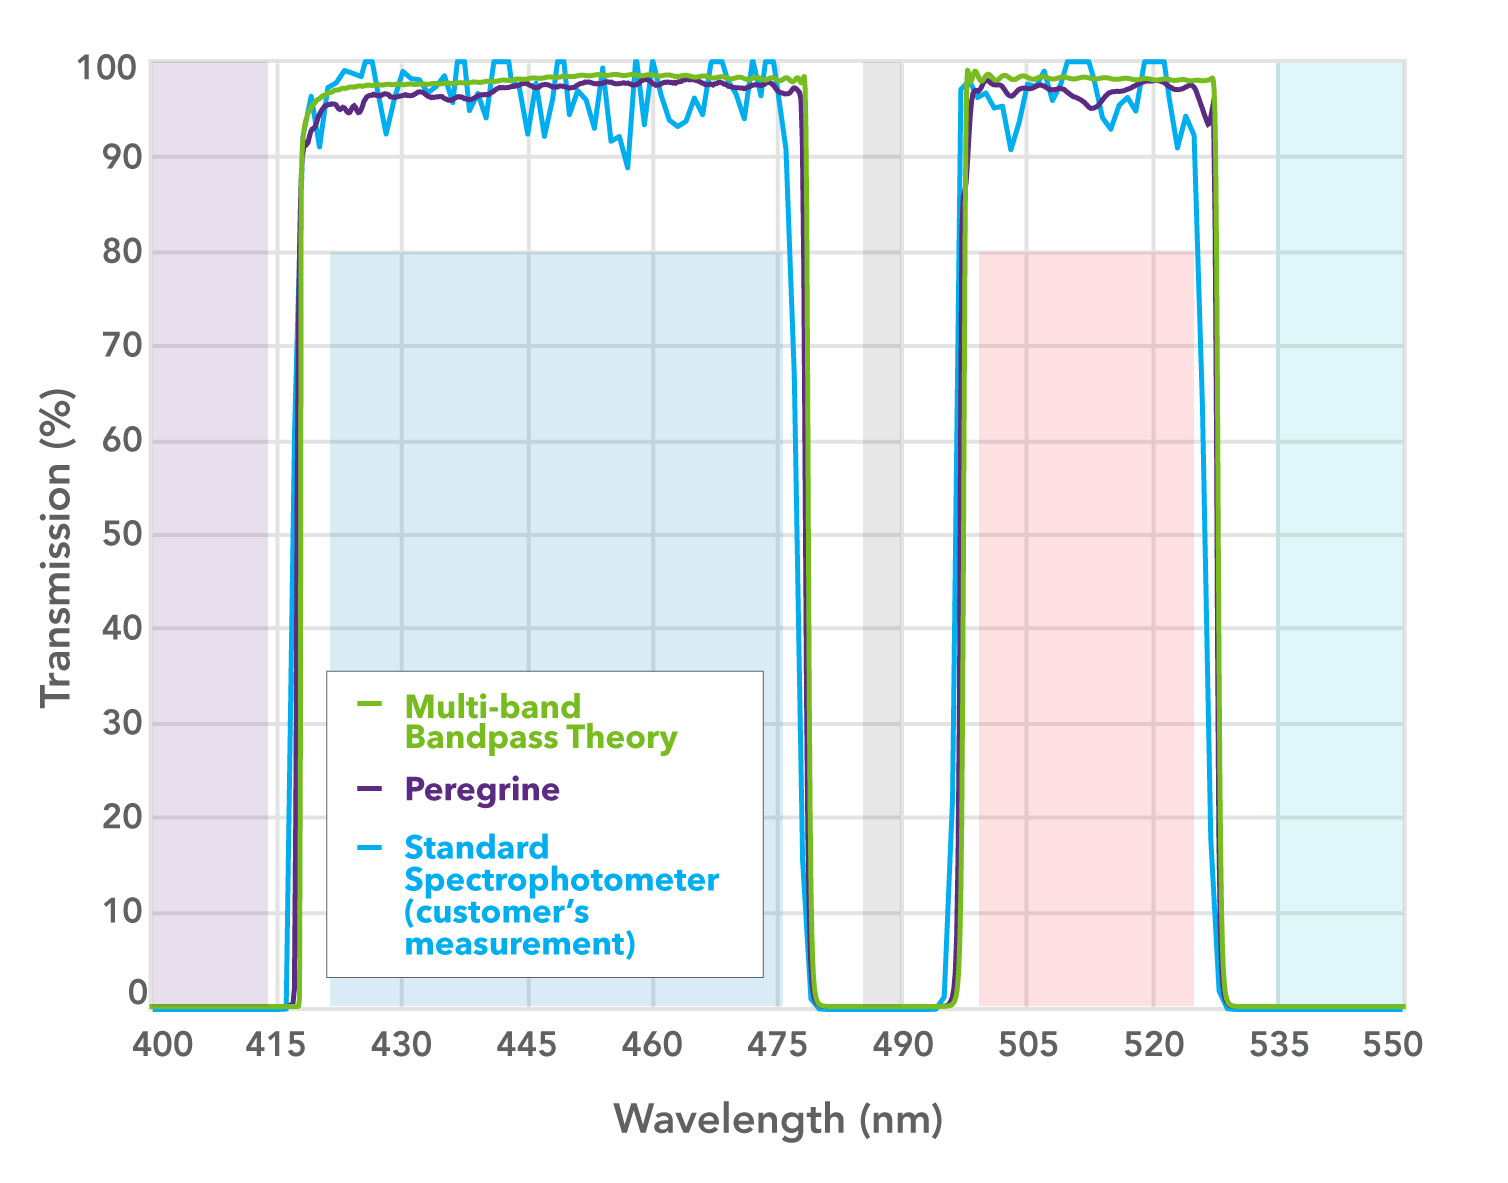
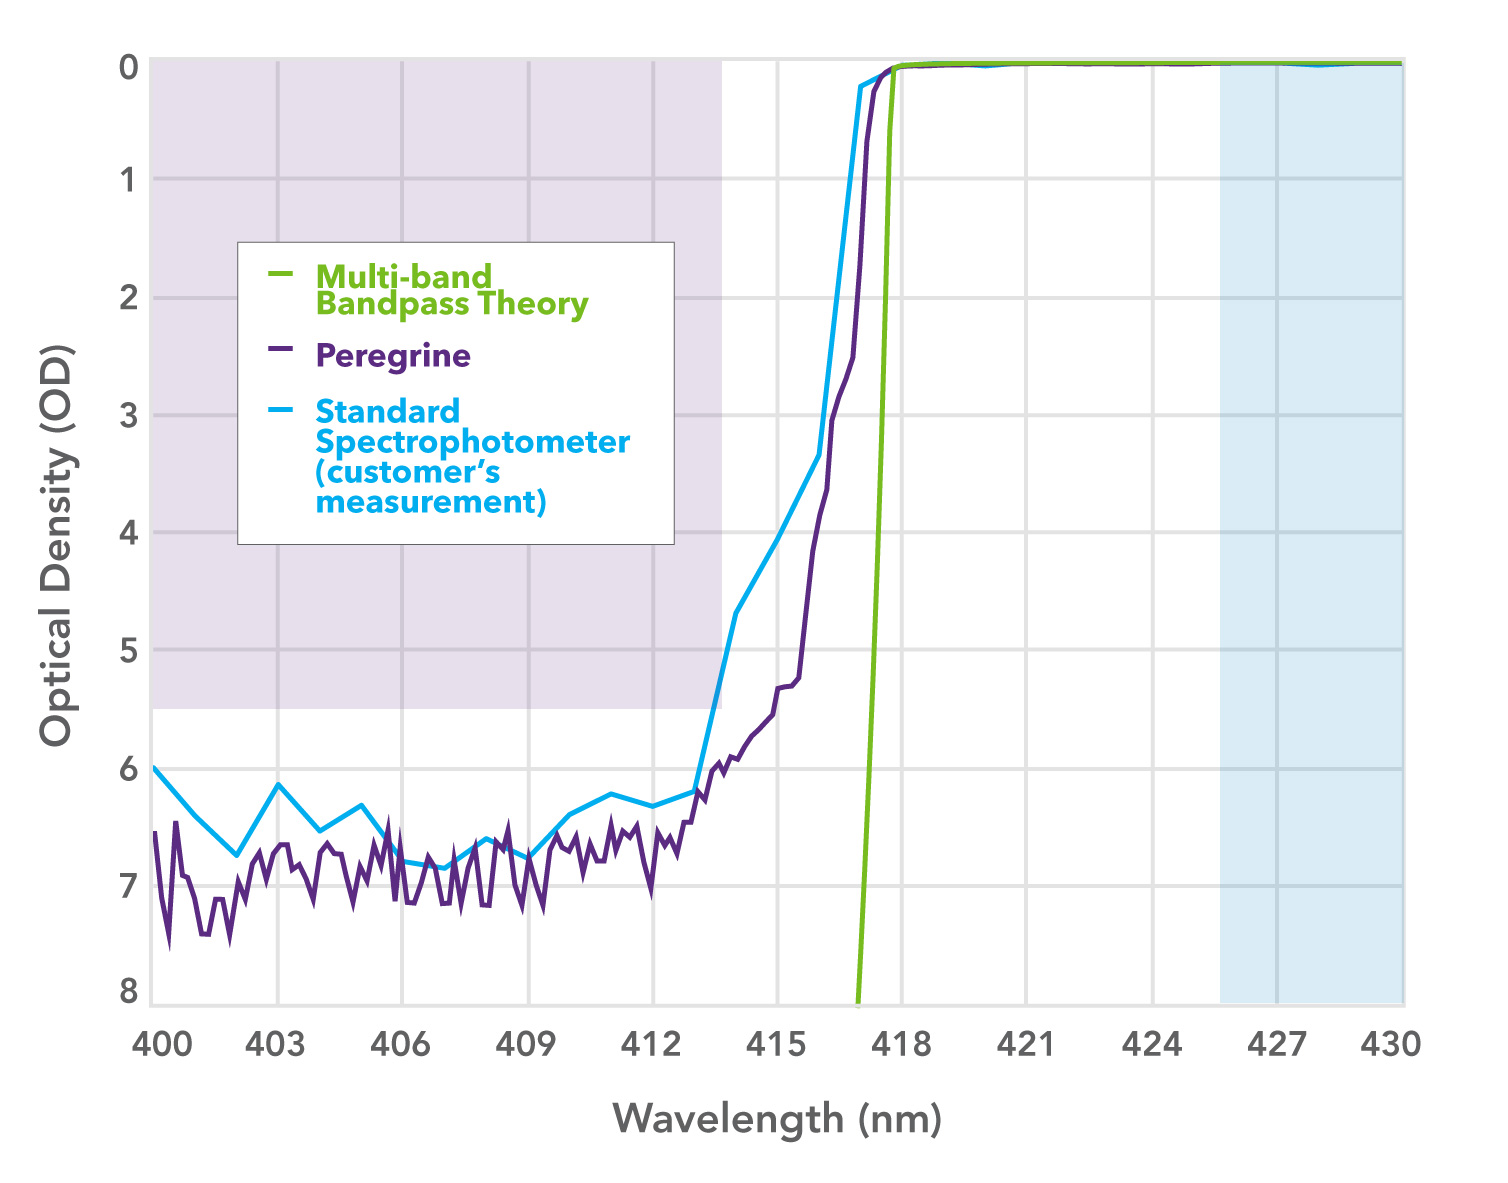
Figure 13. Left: Spectral graph of transmission vs. wavelength for a custom multi-band bandpass filter. Right: Expanded view of the first blocking band showing OD vs. wavelength.
Measuring moderately steep edges at low AOI is also challenging, especially when deep blocking is required. This case is not dominated by measurement CHA as in the previous examples, but by other measurement limitations that are more challenging to model. If the measurement conditions are not suitable, the three earlier described discrepancies between actual and measured spectra will be evident.
Figure 13 shows the example of a custom multi-band bandpass filter with steep edges and deep blocking to be used at AOI = 0°. Measured data from a standard spectrophotometer (blue) show rounding of sharp spectral features, distorted passband edges, and reduced edge steepness that could be mistakenly interpreted as violating the ODabs > 5.5 specification.
In comparison the Peregrine SMS measurement (purple) accurately measures the passband edges, in agreement with the design theory (green); the ODabs > 5.5 specification is met.
Measuring ultrasteep edges
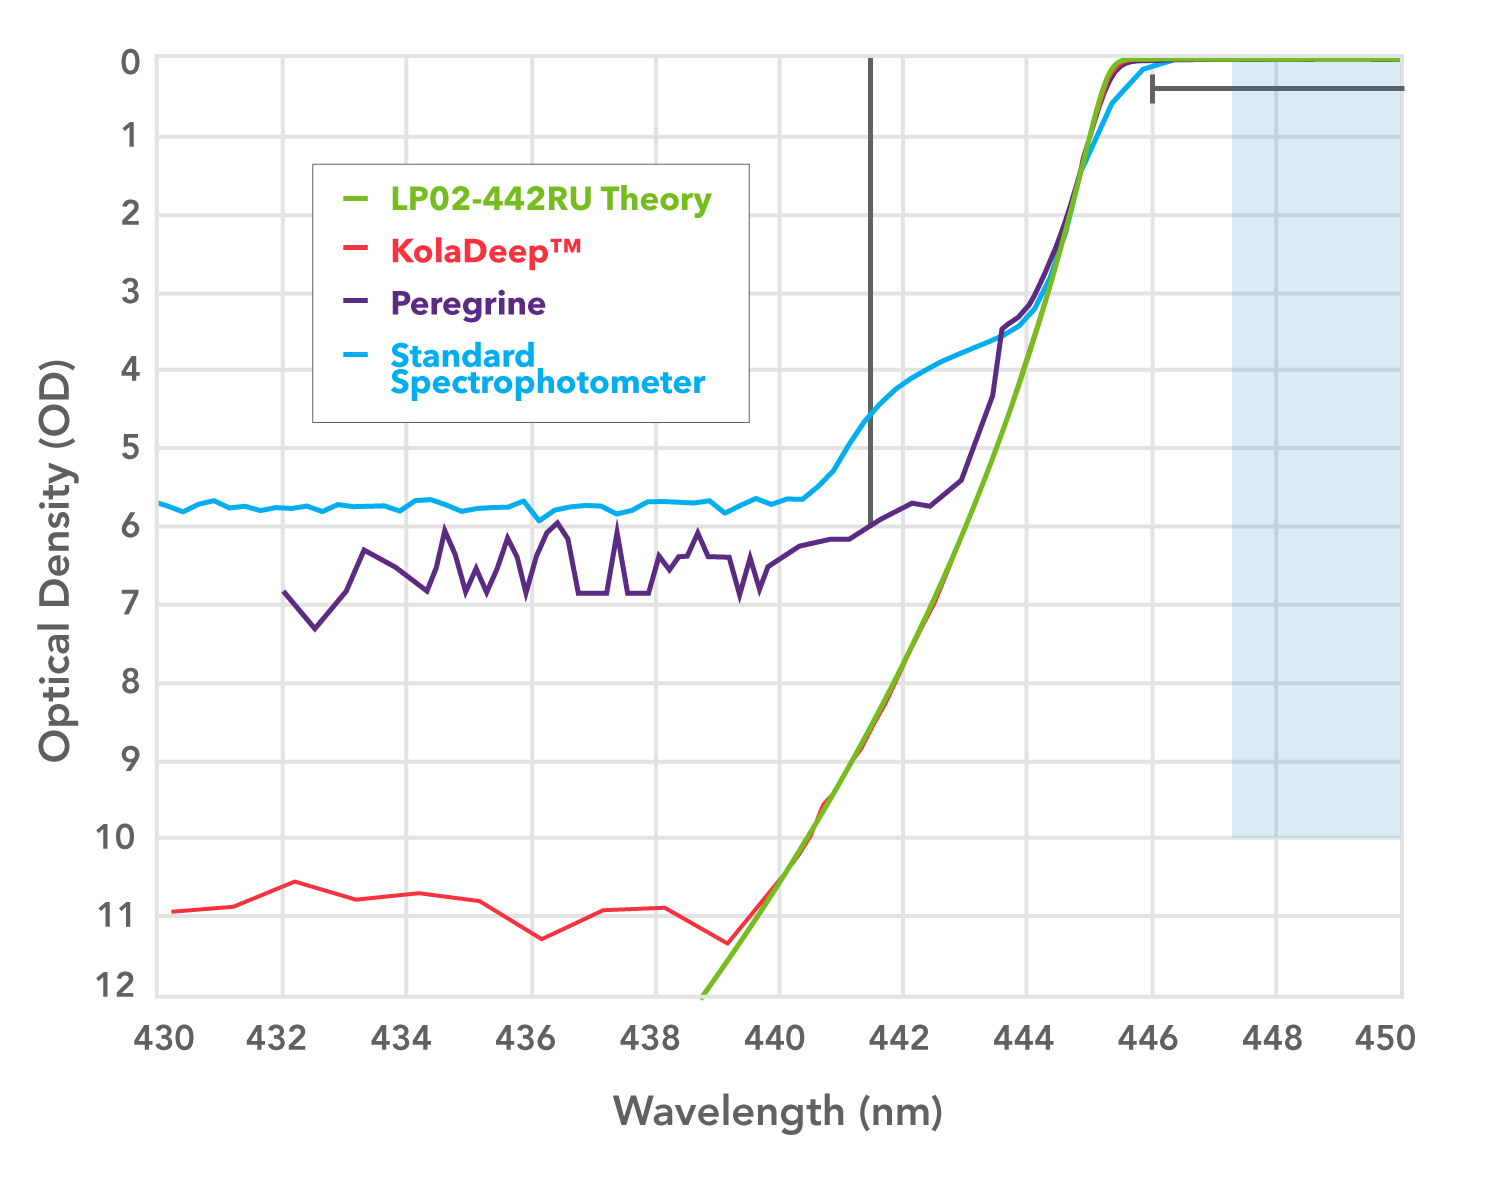
Figure 14: Spectral graph of OD vs. wavelength for Semrock RazorEdge ultrasteep long-pass edge filter LP02-442RU.
The Peregrine SMS was designed to characterize the spectral performance of filters with a high degree of accuracy. However, measuring a filter with very steep and deep edges requires an even more capable spectral measurement system, for which IDEX Health & Science developed the new KolaDeep SMS.
This is illustrated in Figure 14 showing the measured spectra of a U-grade Semrock RazorEdge long-pass filter designed to block a laser line at 441.8 nm with OD > 6, TW < 1% (4.4 nm) of the laser wavelength and ES ~0.5%. The measured spectra are overlaid on the design spectrum of the filter (green). The choice of measurement system is seen to significantly affect the measured filter spectrum.
The limitations of a standard commercial spectrophotometer (blue trace) prevent easy assessment of the performance of the filter, which would not be seen to achieve the required OD > 6 at 441.8 nm.
The measurement with the Peregrine SMS (purple) uses instrument settings for accurate measurement of the steep and deep edge, including the sharp “corner” at 445.6 nm. The sideband measurement artifact is still apparent, as manifested by a decrease in apparent edge steepness for OD > 3, which prevents the graph from being used to confirm OD > 6 at the laser line.
The measurement with KolaDeep (red), on the other hand, closely approximates the design theory (green).
As a postscript, it is instructive to ask how the performance of Semrock filters was assessed before the availability of the KolaDeep SMS. In one method, additional spectral filtering of light within the test filter passband reduces scattered light at other transmitted wavelengths close to the critical edge, reducing background and the sideband artifact. Another method uses the “slope method,” in which filter blocking at higher OD is inferred from the measured transmission, by comparison to the theoretical filter design, using a model for spectrophotometer performance and coating and manufacturing process variations. When supported by measurements on samples and periodic verification via laser measurements of single-wavelength OD values, these approaches suffice in absence of more accurate metrology equipment. However, such methods are more labor-intensive and require the use of safety margins to prevent noncompliant shipments.
Conclusion
Measurement is fundamental to the sciences, and our ability to make measurements underpins our ability to improve processes and devices in our environment. This principle is embodied in a key deliverable, initiated by Semrock, Inc., that IDEX Health & Science maintains as essential: proving that produced filters meet every measurable specification on the page. This white paper illustrates the efforts made and the successes reached as the company continues its innovative pace. The forward impulse provided by the development of the KolaDeep SMS will support further advances in optical filter development over the coming years.
Acknowledgements
The authors express deep appreciation to Craig Hodgson, PhD, Jean-Philippe Rheault, and Jacob Schindler, for their unstinting help with discussions and measurements.
A significant part of this review was based on the earlier white paper on this topic by Prashant Prabhat, PhD, and Turan Erdogan, PhD, titled “Measurement of Optical Filter Spectra,” to whom we are most indebted.
Finally, we thank our customers for being a very large part of this story with their feature requests and support.
Authors
Michael Delay, PhD and Anne Souchon
References
[1] IDEX Health & Science Receives the 2021 Laser Focus World Innovators Award, PR Web
[2] Transition Width and Edge Steepness definition.
[3] M. Lequime, M. Zerrad, and C. Amra, “Breakthrough spectrophotometric instrument for the ultra-fine characterization of the spectral transmittance of thin-film optical filters,” Opt. Express 26, 34236-34249 (2018).
[4] A. Johansen, A. Czajkowski, N. Cooper, M. Scobey, P. Egerton, and R. Fortenberry, “A new spectral analysis system designed to measure high-performance optical filters,” Alluxa White Paper Series (2017).