
Optical Filters FAQs
Here we have provided comprehensive lists of commonly asked questions regarding our Semrock optical filters and related applications. This information is designed to support your inquiries, but if you don’t find the answers you are looking for we encourage you to contact us for further assistance.
Please use the sort buttons in the left navigation to navigate between questions and answers that are specific to Optical Imaging Systems, Fluidics, Cameras, Microfluidics, our Webstore, and Engineering Partnership.
What is ASCII Data?
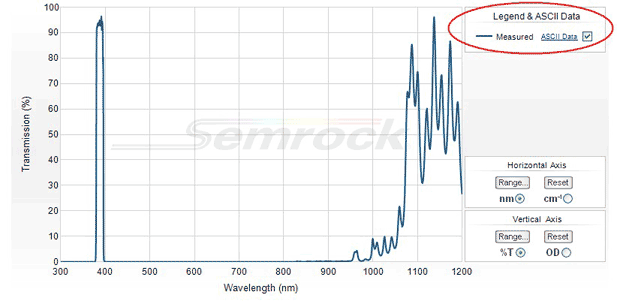
ASCII data is typically a text file with two columns. The first column is the wavelength (measured in nanometers) and the second column is the corresponding transmission value of the filter at that wavelength. The transmission value is either on a scale of 0 to 1 or of 0% to 100%. ASCII data is available to download for all filters on the Semrock website. Most filters show actual measured data, while a few filters have theoretical data listed. The legend indicates that the displayed data is either measured or theoretical.
When you are viewing a filter's details you will find a link to the ASCII data for that filter to the right of the graph. Click on ASCII Data to save a copy of the text file that can be used to graph the filter's spectra.

If you need theory data on a single filter, use the blue MyLight button found above the graph and model your theory data, as well as download your ASCII data.
