How Much is Your Photon Worth? Selecting Optimal Optical Filters

Overview
Fluorescence-based assays depend on detecting photons. Common to such assays is the notion of the “good” photon, which carries useful assay information, and the “bad” photon, which carries noise, background, or other information that imperils the assay. Depending on their design, optical filters can shift photons from the “bad” to the “good” category, but optimizing filter selection also requires choosing a filter with the right balance between performance and price point. That balance is explored in this presentation.
IDEX Health & Science specializes in the design and production of optical systems and components used in microscope-based applications such as spatial biology, sequencing, high-throughput screening, Raman, and fluorescence microscopy. These components include optical filters and microfluidic components as well as objective lenses, excitation subsystems, and source-to-sensor systems.
“Good” and “Bad” Photons in Fluorescence Assays
In a typical fluorescence assay, photons arrive at detectors with varied histories. However, not all photons contribute constructively to the signal. While “good” photons carry useful information about the assay, “bad” photons carry signals that can negatively affect the assay, such as noise, background, crosstalk, autofluorescence, or non-specific fluorophore binding.
A robust assay might be less sensitive to the proportion of bad-to-good photons passed to the detector(s), and a more sensitive assay may well need more good photons to succeed. In either case, each optical filter in a system plays a role in affecting the balance of “good” and “bad” photons reaching the detector.
One can use post-acquisition analysis to partially correct the data, e.g., reducing effects of crosstalk, but note that filter manufacturing variability and other issues can set a limit on the effectiveness of such corrections. Though optical filters cannot improve every photon in the optical system to the “good” state, it is useful to have an idea of the extent to which optical filters can improve or even degrade system performance.
Cost vs. Performance of Optical Filters
IDEX Health & Science designs and produces several families of optical filters. The design criteria of each of the families are oriented around a well-defined performance envelope. Each set of family-specific filters has features that are expected to affect the balance of “good” and “bad” photons passed by the respective filters.
Besides these features, each filter family has a cost range which depends on several factors, of which cost of manufacture is of course very relevant. The customer is therefore offered a choice of performance options at a choice of price points. A top-line filter may have better rejection of “bad” photons than a mid-line filter – but that may not always be necessary or cost-effective.
The “Photon Worth” Concept
A photon can in a sense be assigned a “worth” depending on its criticality or its usefulness in the assay being performed. There are multiple usages of “photon worth,” e.g., the number of fluorescent photons a molecule emits per unit time, but this is not the meaning used here. Instead, a photon is said to be worth “more” if it is used in an assay with a more demanding set of requirements, e.g., it is more sensitive to “bad” photons. In other words, we refer to “photon worth” as the extent to which the photon benefits the intended use.
Towards a Cost-Benefit Analysis
In this Tech Note, we demonstrate part of a cost-benefit analysis that relates the “worth” of a photon to the performance of the optical filters used. This will allow one to assess if a filter set has an acceptable price/performance ratio with respect to noise and crosstalk and allows one to optimize filter selection considering budget and performance.
For this we can use Searchlight™, an open-use tool for modeling photon flow in fluorescence-based optical systems. We will consider aspects of two scenarios: Flow Cytometry and Epi-illumination Microscopy. Figure 1 summarizes the SearchLight environment.
Summary of SearchLight Modeling Software
Figure 1. (L) The system model used in Searchlight. Light from an excitation source is selected by passing through an excitation filter and reflects off a long-pass dichroic beamsplitter towards an objective lens whose focused output is incident on the sample. The emitted fluorescence is partly captured by the same objective and directed towards the same dichroic, an emission filter, and the detector. Each optical element has a wavelength-dependent performance as indicated. (R)
Schematic spectra of the relevant components in a single-wavelength scenario. The excitation and emission spectra of the fluorophore are shown as blue and red dashed lines, when excited by a light source whose spectrum is shown as a solid black line. The three optical filter spectra are shown as solid lines. Refer to our SearchLight White Paper for a more complete description.
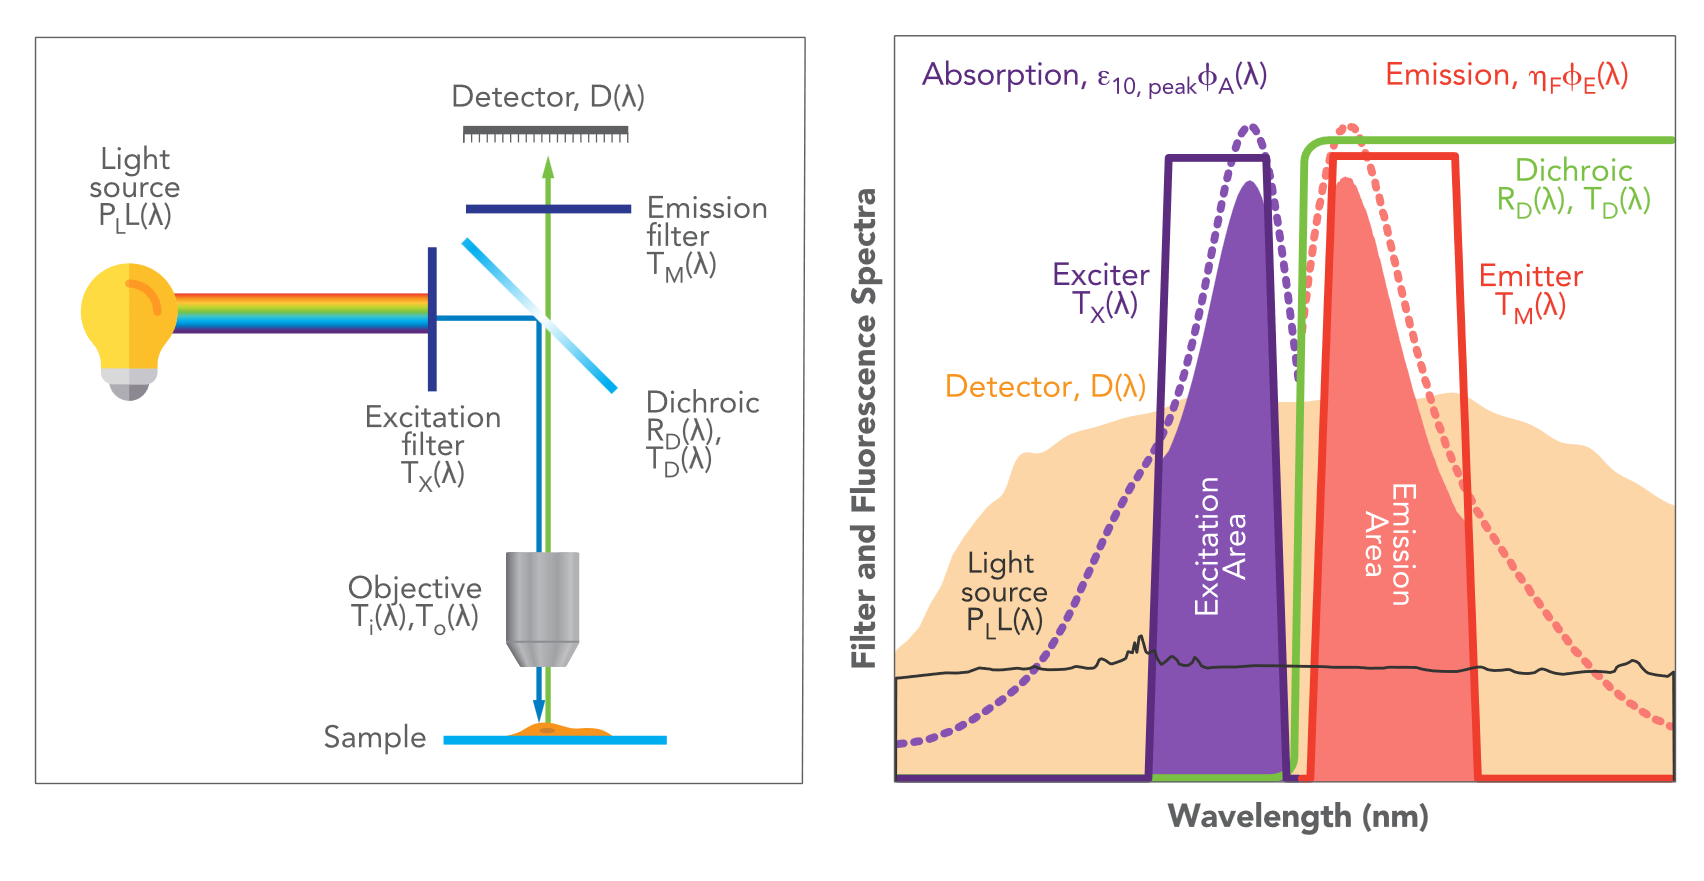
Figure 2. Upper SearchLight window. Users can select elements from a database of selectable filters, filter sets, fluorophores, light sources, detectors, and custom data, all on the left panel. The center panel shows the chosen spectra, and the right panel shows the chosen elements.
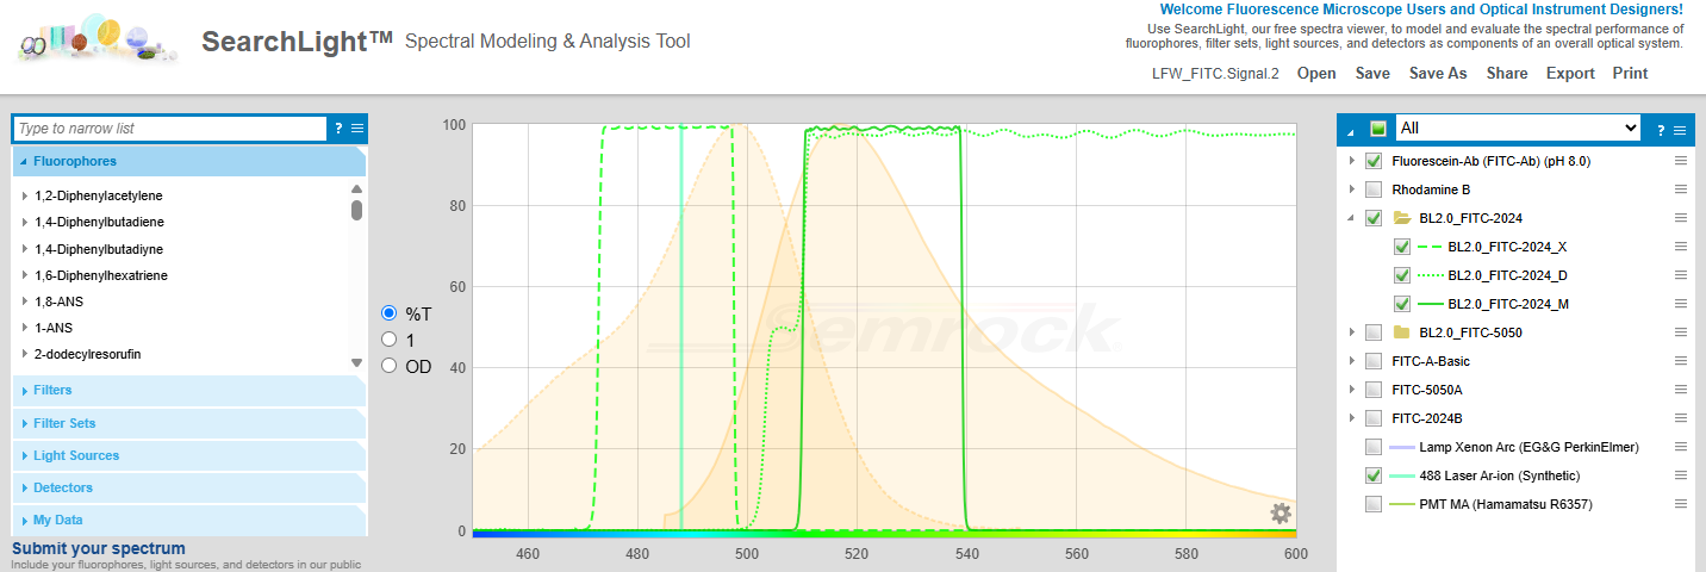
Figure 3. Lower SearchLight window. On the left upper panel, the user selects the combination of filters, filter sets, fluorophores, light sources, and detectors, to be used to calculate the quantities of interest. The calculation results are shown on the right upper panel. The lower panel allows entry of optical parameters that are critical to the scenario being modeled.
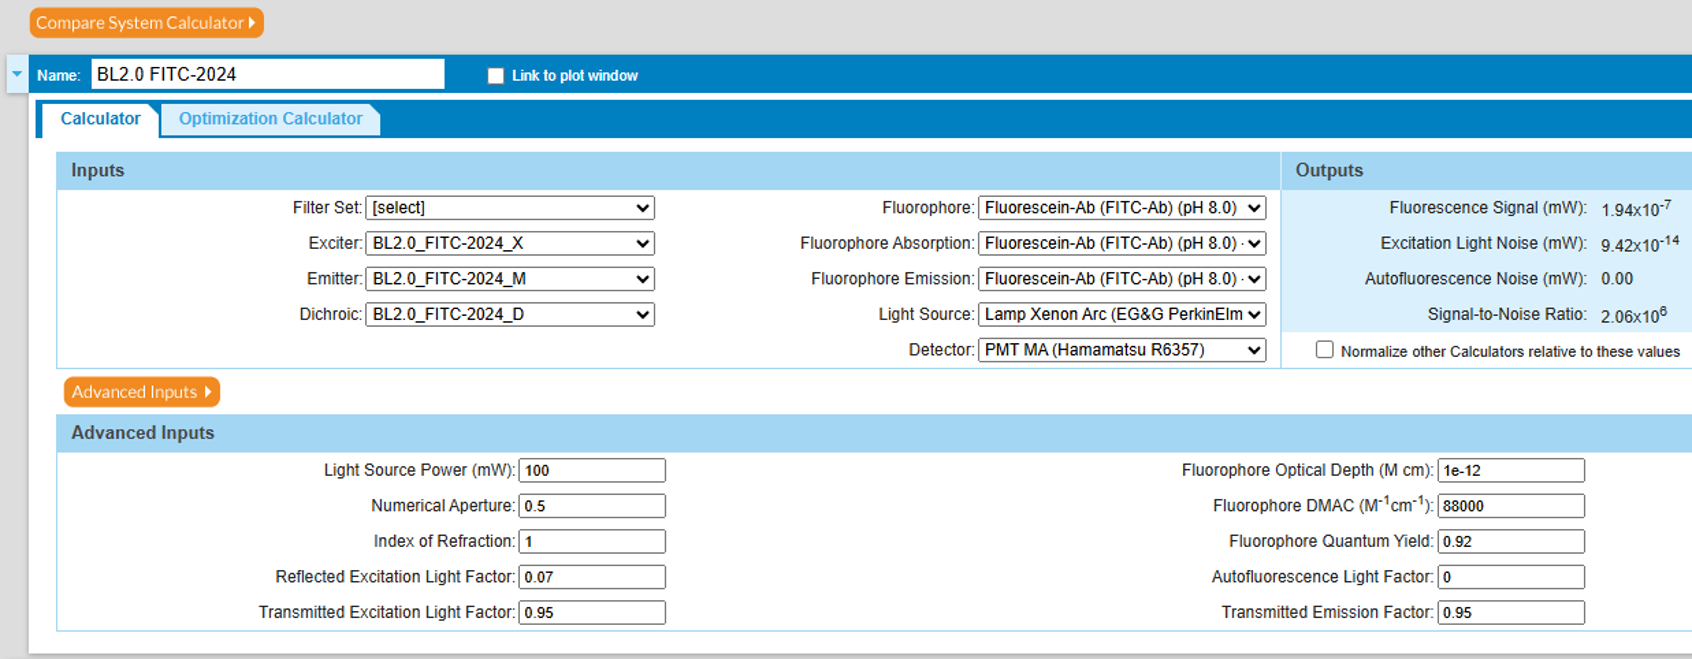
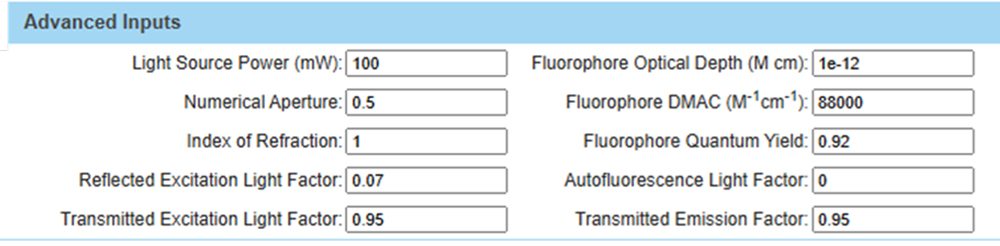
Figure 4. Explanation of key optical parameters in the SearchLight model, as shown in the “Advanced Inputs” section of Figure 3.
Figure 5 gives a detailed view of the Advanced Inputs. The value of 7% shown for the Reflected Excitation Light Factor is characteristic for an epi-illumination microscope, since the emission light is captured at 180° with respect to the excitation beam. Much of the same optical path is used by both excitation and emission processes. The value is often significantly lower, e.g., 0.1% to 0.5%, in flow cytometry or similar systems that capture emission light at 90° with respect to the excitation beam. SearchLight can thus be used to model the effects of reflected light in these two schemes.
Figure 5. Detailed view of the Advanced Inputs section.
Based on the configuration parameters, Searchlight calculates Fluorescence Signal, Excitation Light Noise, and Autofluorescence Noise (all in mW), as well as the Signal-to-Noise ratio (SNR), shown in Figure 6. The optical SNR is calculated
as the Fluorescence Signal divided by the sum of the Excitation Light and Autofluorescence Noise values. It does not include photoconversion efficiencies, shot noise, or various effects in the detection apparatus.
Figure 6. Calculated values of parameters of interest given the input data described in the text.
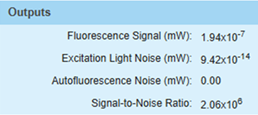
Excitation Light Noise is the undesired noise power that reaches the detector via reflection from the sample as quantified by the Reflected Excitation Light Factor. It is highly sensitive to the overlap and edge steepness of the excitation and emission filters, and to the level and extent of out-of- band blocking. Inadequate blocking filters for emission or excitation will result in a large amount of this noise. It is very relevant to filter price discussions that the steepness of filter edges and blocking capabilities significantly drive costs.
The BrightLine® to BrightLine® 2.0 Filter Set Transition
BrightLine filter sets from IDEX Health & Science are industry-standard high-performance optical filters sets for commonly used fluorophores. BrightLine filter sets for commonly used fluorophores are named with nnmm where nn is the excitation bandwidth in nm, and mm is the emission bandwidth.
BrightLine 2.0 is the recently introduced family of high-performance optical filters for use with popular fluorophores, replacing the original BrightLine filter sets that have been an industry standard since their introduction 20 years ago.
A key improvement in Brightline 2.0 is the deeper out-of-band blocking and greater critical edge steepness. These two parameters contribute significantly towards Excitation Light Noise, as mentioned previously. This is seen in Figure 7, that compares the SearchLight outputs under identical conditions except for the choice of filter set. The original BrightLine FITC 2024 set has a standard SNR of 684, but the BrightLine 2.0 set far exceeds this under the same conditions.
Figure 7. Comparison of original SearchLight and SearchLight 2.0 SNR performance for the FITC filter sets.
| ORIGINAL BRIGHTLINE FITC 2024B SET: | BRIGHTLINE 2.0 FITC 2024 SET: |
| Fluorescence Signal (mW): 1.95x10⁻⁷ | Fluorescence Signal (mW): 1.94x10⁻⁷ |
| Excitation Light Noise (mW): 2.85x10⁻¹⁰ | Excitation Light Noise (mW): 9.42x10⁻¹⁴ |
| Autofluorescence Noise (mW): 0.00 | Autofluorescence Noise (mW): 0.00 |
| Signal-to-Noise Ratio: 684 | Signal-to-Noise Ratio: 2.06x10⁶ |
If the SNR of the original BrightLine set were to decrease due to reduced signal, or increased background due to higher levels of backscattered light from the sample due to turbidity or use of intact tissue, the lower SNR may result in issues with
data interpretation. The BrightLine 2.0 SNR is therefore much more immune to such signal diminution, compared to the original BrightLine.
Thus, the BrightLine 2.0 sets can be regarded as significantly increasing the average photon “worth,” by increasing the proportion of “good” photons. The fact that the BrightLine 2.0 sets are essentially cost-neutral improvements on the original BrightLine sets has justified the design and release of these new sets.
FITC Set Cost vs. Crosstalk Performance at Normal to High Light Levels
SearchLight can be used to model crosstalk with use of the different members of the FITC filter set family to gain insight into the cost vs. performance question. In this example, we consider the effectiveness of the different FITC filter sets, with their range of excitation and emission passband widths, at maintaining good SNR and low crosstalk. Table 1 below summarizes the SearchLight results.
In this example (and the next) the Reflected Excitation Light Factor is assigned a small (0.5%) value, similar to flow cytometry setups, as opposed to the previous example’s larger (7%) Factor appropriate to an epi-illumination microscope. The SNR
is expected to improve in this case due to the low level of reflected light reaching the emission filter.
Table 1. The ‘Filter Set’ column specifies the FITC filter set name; ‘Cost’, the filter set cost relative to the BrightLine 2.0 FITC-2024 cost; ‘Laser + Rhodamine’, the Rhodamine crosstalk when a laser is used for excitation; and ‘Xe Lamp + Rhodamine’, the Rhodamine crosstalk when an Xe lamp is used. ‘Crosstalk’ refers to the Signal level due to FITC divided by the Signal level when an equal amount of Rhodamine replaces the FITC.
| FILTER SET | COST RELATIVE TO BL2.0 FITC-2024 | LASER + RHODAMINE | Xe LAMP + RHODAMINE |
| BL2.0 FITC-5050 | 0.97 | 13.6 | 13.4 |
| BL2.0 FITC-3540 | 0.97 | 19.0 | 20.4 |
| BL2.0 FITC-2024 | 1.00 | 131.2 | 136.9 |
| FITC-A-BASIC | 0.87 | 42.1 | 34.9 |
The FITC-5050 set has a 50 nm wide passband for both exciter and emitter filters. The costs of these FITC sets are uniform (‘Cost’ column). The Excitation Light Noise limited SNR is uniformly good for all these filter sets (not shown), and lower crosstalk results from the narrower passbands as expected. The lower-cost FITC-A-Basic set does quite well in suppressing crosstalk, compared to two of the three of the BL2.0 sets, and the set has good value for intermediate performance. This is not necessarily the rule for all such Basic sets -- one must check case by case.
FITC Set Cost vs. SNR Performance at Low Light Levels
At very low excitation light levels, Excitation Light Noise limited SNR depends on filter set and light source, as shown in the table below that shows SNR values in the two rightmost columns, for laser- and broad-spectrum light sources. At these very low fluorescence levels, out-of-band contributions from a broad-spectrum light source may prevent useful results by reducing the proportion of “good” photons. Here the FITC-A-Basic set is less suitable due to its low SNR, independent of light source.
| FILTER SET | COST RELATIVE TO BL2.0 FITC-2024 | LASER | Xe LAMP |
| BL2.0 FITC-5050 | 0.97 | >>106 | 13.2 |
BL2.0 FITC-3540 | 0.97 | >>106 | 10.8 |
| BL2.0 FITC-2024 | 1.00 | >>106 | 3.2 |
| FITC-A-BASIC | 0.87 | 12.3 | 0.3 |
Summary
- The Pain: Optical filters do not perform as intended or hoped for and/or have excessively high cost.
- The Challenge: Define a robust strategy to characterize and choose filters with explicit view to cost control.
- The Solution: Include cost-benefit analysis of filter cost-functionality relationship.
- Expected Results: Rationally chosen and costed filters assured of adequate performance.
Acknowledgements
The author is grateful to Dr. Sarah Locknar for initial concepts and analysis.
Additional Resources
Want to explore other optical filter tech notes, white papers, or catalogs? | |
| Have a question? | Visit our FAQ section or connect with our team of optical filter experts. |