
Stories & Features
How can you know a Semrock optical filter will work in your system under the different optical conditions present?
Understanding the performance of your optical filters under varying conditions is not just important; it’s the backbone of an optimal system design. Accurate tools for filter modeling are must-haves for the designer.
IDEX Health & Science has a solution that allows you to optimize your optical filter designs for your system.
Welcome to MyLight™, our online optical filter modeling tool that allows you to quickly characterize the theoretical spectral behavior of our Semrock filters under various conditions. Watch our tutorial video below, or scroll down for a step-by-step guide.
Traditionally, optical filter data only presents standard conditions, but MyLight changes that. Whether your system uses a range of beam angles or a cone of illumination, MyLight lets you input your working conditions to generate a spectral response graph.
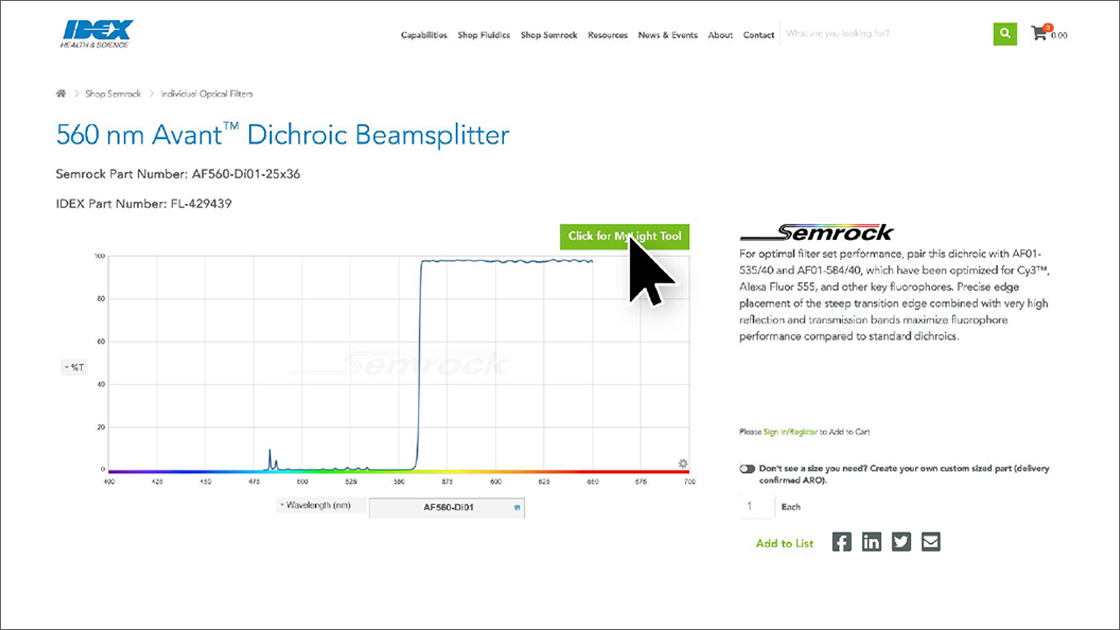
Step 1: Access MyLight directly from any Semrock filter page. On the right, just above the measured data spectra, click the green “MyLight” button to show the initial MyLight graph.
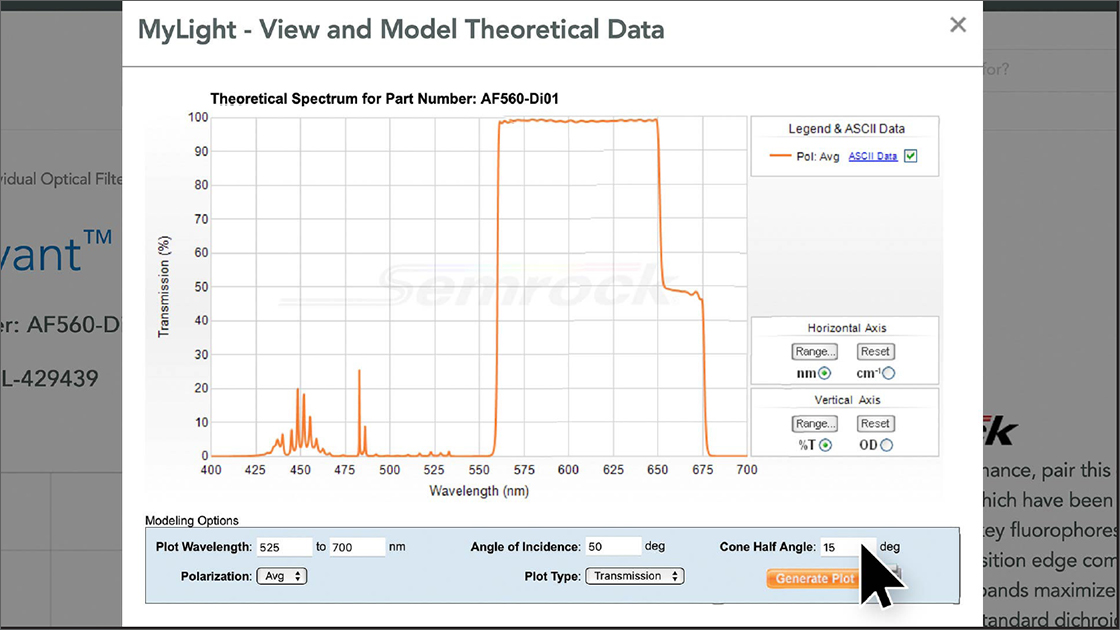
Step 2: Under the graph, enter parameters like Plot Wavelength Range, Angle of Incidence, Cone Half Angle, Plot Type, and Polarization — then click “Generate Plot.” Anytime you change modeling options, click “Generate Plot” again to see the new theoretical data.
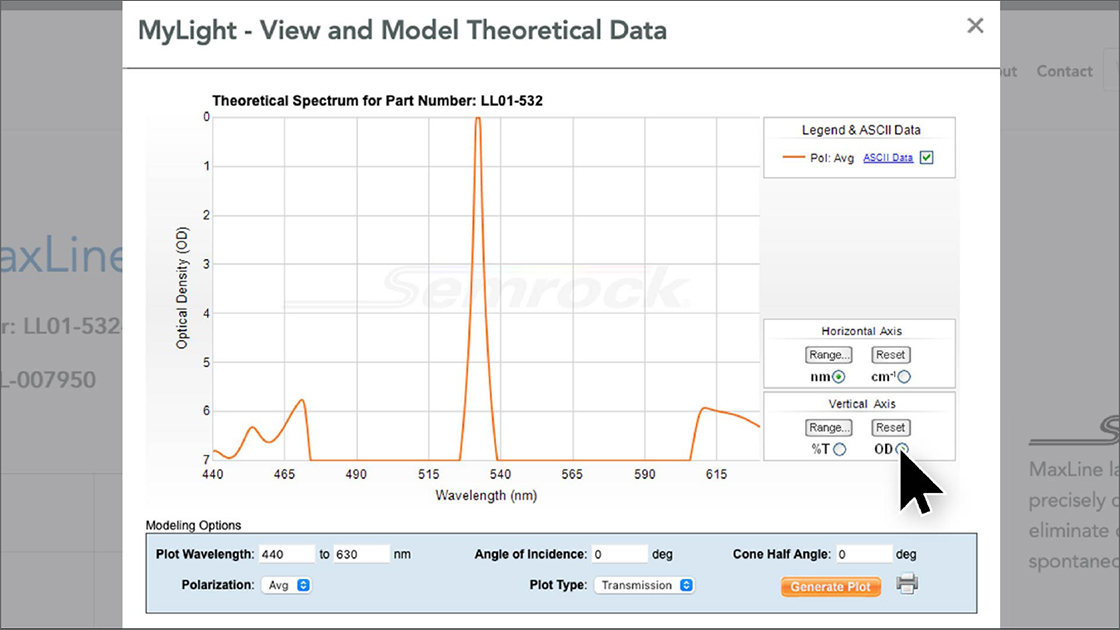
Step 3: MyLight also allows you to adjust the horizontal axis to show nanometers or inverse centimeters and the vertical axis to show the transmission or optical density.
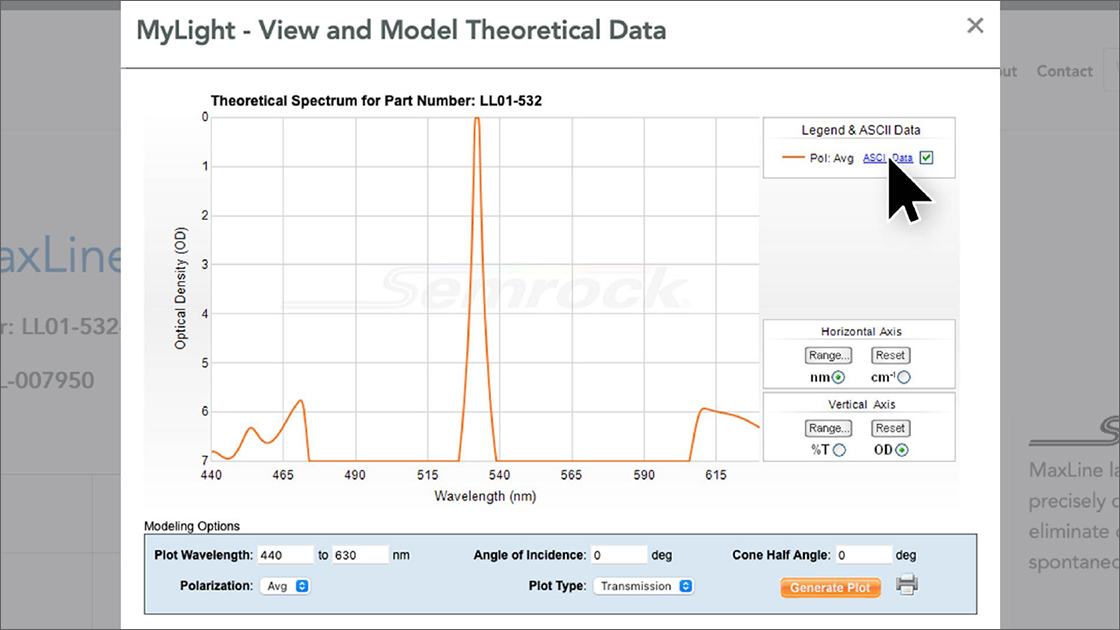
Step 4: You can download the data for further analysis by selecting “ASCII DATA” in the top right corner.
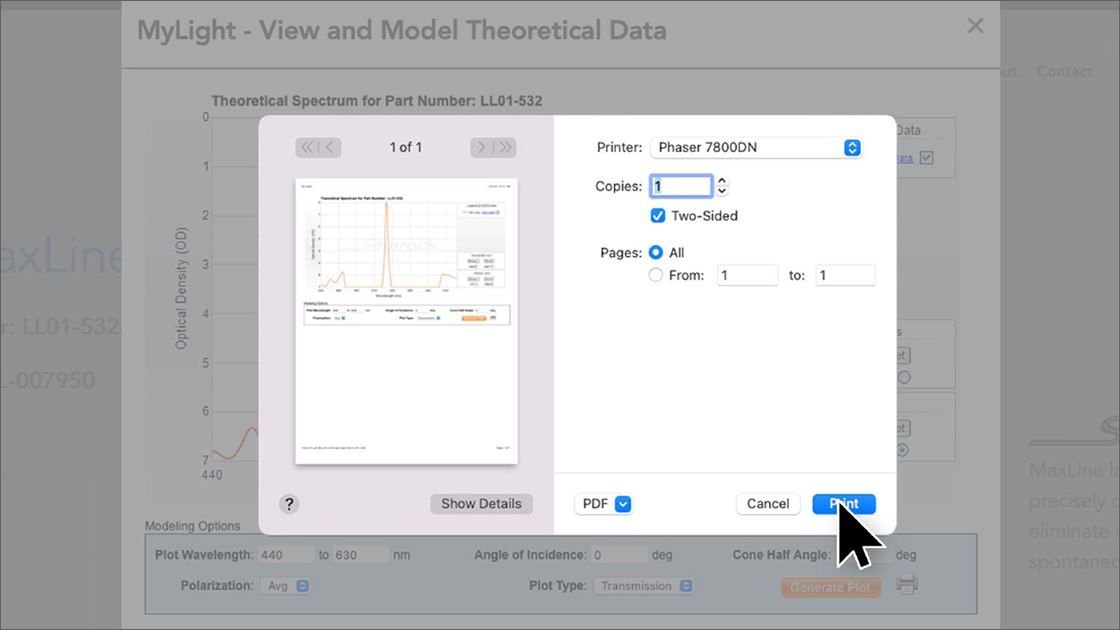
Step 5: Share it with colleagues by clicking the printer icon and saving as a PDF.
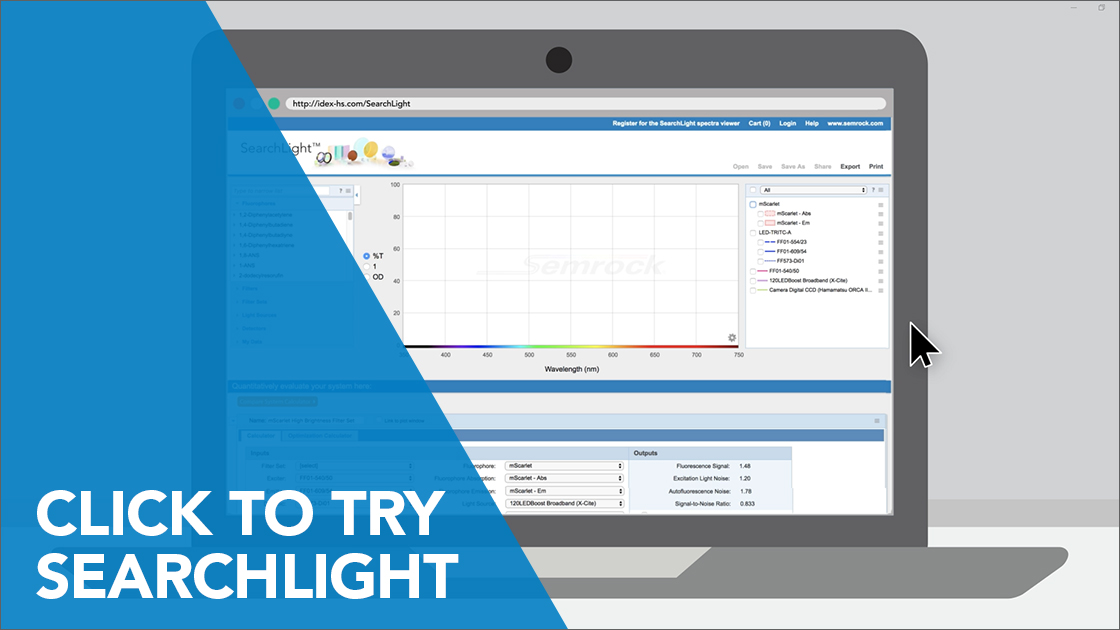
To model the effect of different optical conditions on a complete system, you can use SearchLight™, our online spectral graphing and optical system simulation tool.
SearchLight plots spectra of multiple filters and filter sets on one graph, as well as spectra of fluorophores, light sources, and detectors.
But SearchLight also has a key less well-known capability: Modeling the behavior of an epi-illumination fluorescence system with all those components, to calculate signal, noise, and crosstalk/bleedthrough. This capability is enhanced by the Share
Session feature that allows you to collaborate with others in your group on the optimal set of filters and other components in a fluorescence system.
Click to explore these additional features at: idex-hs.com/SearchLight.