Multimodal NLO Imaging
I. Introduction
Nonlinear optical (NLO) imaging is a powerful microscopy technique that has found increasing use in the field of biomedical optics. In NLO imaging, ultrafast laser excitation is used to exploit several nonlinear optical effects that can provide high-contrast imaging of biological samples. Common NLO imaging modalities are two- and three-photon fluorescence (2P & 3P), second- and third-harmonic generation (SHG & THG), and coherent Raman scattering (CRS) in the form of either Coherent Anti-Stokes Raman Scattering (CARS) or Stimulated Raman Scattering (SRS). Although each imaging mode can be used separately, advances in ultrafast lasers and laser systems, coupled with innovative developments in hard-coated optical filter design, now allow the near-seamless combination of several NLO modalities into a single, unified microscope platform. This approach is commonly known as multimodal NLO imaging. One of the key advantages of NLO imaging is the ability to employ both label and label-free imaging strategies when probing the form and function of complex biological samples, such as individual cells and tissue. In this article, we discuss the emergence of NLO imaging and how it has been facilitated by advances in three key technology areas: ultrafast lasers; high-performance, hard-coated optical filters; and high-sensitivity detectors. Fluorophores commonly used in combination with NLO fluorescence imaging will also be discussed.
II. Nonlinear Optical Imaging (NLO) Techniques
Optical microscopy is a ubiquitous imaging technique that has found widespread use across the life sciences and is emerging as a highly valuable tool in biomedical applications. Ideally optical microscopy should provide high lateral spatial resolution, three-dimensional volume sectioning, and high image contrast. All three conditions can be satisfied using established techniques in linear optical microscopy. The most prominent linear microscopy techniques are widefield and laser scanning confocal microscopy. Both approaches are popular choices for studying biological samples, such as single cells and tissue sections, and have led to the development of a variety of advanced imaging techniques, such as super-resolution optical microscopy. However, both rely on the use of exogenous fluorophores to provide sufficient fluorescence signal for high-contrast imaging. Although a prerequisite in most biological imaging applications, the addition of exogenous fluorophores has several distinct disadvantages. Labeling biological samples with small organic dyes or quantum dots can disturb natural processes. The use of high laser powers in laser scanning confocal fluorescence imaging, for example, can lead to irreversible photobleaching and phototoxicity. Irreversible photobleaching ultimately limits the period of time a sample can be used and can be frustrating given the careful and sometimes tedious effort required to prepare samples, especially when labeling protocols involve multiple varying fluorophores. In some instances, phototoxicity can lead to cell death and render the sample useless for further study.
Spontaneous Raman microscopy is a technique that is used when chemical-specific information is required. Spontaneous Raman scattering is a linear process, with the strength of the Raman signal linearly dependent on the number of vibrational oscillators present in the focal volume. Raman microscopy is a powerful tool, as it allows a near-complete understanding of the chemical composition of a sample from a single spectrum. However, most biological molecules have extremely small Raman cross-sections (~ 10-28 cm2), so it is often necessary to collect signal light for many seconds or even minutes to form spectra in which the Raman features are easily distinguishable from one another. (By comparison, a typical fluorescent molecule, such as fluorescein, has an absorption cross-section on the order of ~ 10-16 cm2.) In Raman microscopy it is therefore necessary to use high laser powers in order to obtain chemically-specific images with sufficient signal-to-noise ratio (SNR). As is the case in laser scanning fluorescence microscopy, for example, the use of high laser powers can generate a large background autofluorescence signal that reduces the overall image contrast.
Many of the aforementioned issues associated with linear optical microscopy can be overcome by exploiting nonlinear processes, the basis of what is commonly known as nonlinear optical (NLO) imaging. As is the case in linear optical microscopy, the requirements for high-resolution, 3D imaging with high SNR should be met. NLO imaging satisfies all three of these basic requirements. To enable high-contrast imaging, NLO microscopy makes use of the high peak powers that can be generated using ultrafast lasers. By integrating a picosecond or femtosecond laser into a standard microscope configuration, it is possible to focus the input laser light at the sample using a suitable high-numerical-aperture (NA) microscope objective. The effective excitation volume from which the nonlinear optical signal is generated is reduced compared to the effective excitation volume in a linear optical microscope. As a result, there is no loss in spatial resolution. Therefore, it is possible to achieve high-spatial-resolution, volumetric (3D) imaging without configuring the microscope in a confocal geometry. A second advantage of NLO microscopy is the fact that the excitation wavelengths used are in the near-infrared (NIR, 700-1500 nm). The use of long wavelength light is important for imaging thick biological samples. Longer wavelengths are absorbed less and optical scattering effects are also reduced. As a result, imaging at depths up to or beyond 1 mm is possible. An additional advantage of NLO imaging is the ability to couple to resonant energy levels of endogenous fluorophores commonly found within biological samples. This serves as a significant advantage over linear fluorescence microscopy, for example, where it is necessary to first label the sample with exogenous fluorophores. Examples of endogenous fluorophores are serotonin and tryptophan. Both types of molecule are found in cells and tissue structures, making it possible to monitor the in-vitro and in-vivo behavior of cells using NLO imaging without the need for additional contrast agents.
As discussed previously, the use of high laser power in confocal fluorescence microscopy can lead to photobleaching and phototoxicity. These effects can be reduced in NLO imaging since ultrafast lasers can deliver high peak power but moderate average power. The power generated by an ultrafast laser relates directly to the temporal width of the pulses contained within the emitted pulse train. Specifically,
Peak Power = Average Power / (Pulse Repetition Rate x Pulse Width)
For a given average laser power, decreasing the pulse width leads to an increase in the peak power. For example, a 10 fs laser pulse (of fixed average power and pulse repetition rate) provides 10 times more peak power than a similar pulse measuring 100 fs wide. As a result, the 10 fs laser pulse results in an increased signal at the detector, even as the average power remains constant (typically < 30 mW). Thus, issues involving sample heating, photobleaching, and phototoxicity can be circumvented in NLO imaging. Several nonlinear optical imaging approaches harness the power of ultrafast laser technology and are commonly used in biological imaging applications, including: (i) multiphoton (MP) fluorescence, (ii) second- and third- harmonic generation (SHG & THG), and (iii) coherent Raman scattering (CRS). Below we describe each nonlinear process and its benefits in biological imaging applications.
A. Multiphoton Fluorescence Imaging
The most widely known and utilized NLO imaging approach is multiphoton (MP) fluorescence imaging. Multiphoton microscopy is possible using either two-photon (2P) or three-photon (3P) excitation. In MP fluorescence microscopy, femtosecond lasers that operate across the wavelength range 700-1100 nm are commonly used. Femtosecond lasers that generate high peak powers are used to increase the probability that two (or three) photons arrive at each sample excitation location simultaneously, thus raising the molecule into an excited state. The molecule then relaxes back down to the ground state, emitting a single fluorescence photon in the process. The emitted fluorescence generally occurs at visible wavelengths (400-600 nm). The flexibility of MP fluorescence imaging is readily understood and easily appreciated by the fact that it is possible to utilize the technique with or without the use of exogenous fluorophores. In one embodiment, 2P fluorescence imaging can be used in conjunction with the same fluorophores commonly used in linear fluorescence imaging. Examples of dyes that are suitable for 2P fluorescence imaging applications are Rhodamine B, Cyanine 5 (Cy 5™), and AlexaFluor® 647 [1]. More recently, fluorescent proteins such as GFP, RFP, and CFP, have found increasing use in 2P fluorescence imaging studies of live tissue and whole animals [2]. Label-free 2P fluorescence imaging is also possible. The vast majority of biological specimens, such as cells and tissue, contain a host of intracellular sources of fluorescence that can be addressed optically using multiphoton imaging techniques. Sources of intracellular fluorescence are nicotinamide adenine dinucleotide (NADH), flavins, and tryptophan, and all can be used to interrogate and understand the health of cells and tissue samples in their natural unperturbed state [3]. The ability to generate images with high contrast using intrinsic fluorescence sources also paves the way for the development of NLO platforms that can be used in medical applications in hospital settings, where a label-based imaging is undesirable.
B. Harmonic Generation Imaging
Alternative label-free, NLO imaging approaches also exist. Two of the most commonly used are second- and third-harmonic generation (SHG and THG). SHG is an energy-conserving, coherent, nonlinear scattering process in which two incident photons having optical frequency w (wavelength l) interact at the sample to create a single emission photon having twice the energy and therefore frequency wSHG = 2w (i.e., half the wavelength, lSHG = l/2) [4]. A prerequisite for SHG is that the sample must exhibit a high degree of noncentrosymmetric molecular organization in order to generate appreciable SHG signals, since symmetry prevents even harmonics of molecular oscillations. In addition, high-peak-power laser light is required to increase the probability that two photons are in the same place at the same time. The latter is achieved in SHG imaging by using a single NIR femtosecond laser. SHG imaging has found growing use in biological imaging applications and has been used to spatially map tissue boundaries [5] and elucidate the structure and health of collagen fibrils [3,6].
Third-harmonic generation (THG) is another label-free nonlinear optical imaging modality. THG is a coherent process whereby light with optical frequency wwavelength l is converted into light with optical frequency 3wl THG = l/3). Similar to SHG, THG imaging requires only a single femtosecond laser beam operating across the wavelength range 1.0 – 1.5 mm. Although the THG process is well understood in crystals, careful consideration is required for biological imaging applications. Image contrast in THG microscopy of biological samples strongly depends on the coherence and wavelength tripling effects within the sample. For the case of strongly focused femtosecond laser beams incident on dispersive, isotropic media, no third-harmonic signal can be detected in the far-field (i.e., detector plane), due to an effect known as the Gouy phase shift [7,8]. Basically, the Gouy phase shift is a physical phenomenon whereby a phase shift (totaling occurs across the focal region and leads to destructive interference among the third-harmonic light waves. Moderate focusing of the input beam helps circumvent this problem; however, dispersive effects lead to a reduction in energy conversion between the input w) and output beams (3w) and can reduce image contrast. THG microscopy is most commonly used in NLO imaging applications to detect interfaces or other heterogeneities. A recent example of the benefits of THG imaging was the identification and delineation, with high spatial resolution, of membrane boundaries in studies of embryonic development in zebrafish [5,9,10]. Because only a single femtosecond laser is required, it is relatively straightforward to integrate both SHG and THG imaging with 2P (or 3P) fluorescence imaging. Energy level diagrams that describe the nonlinear processes involved in 2P fluorescence, SHG, and THG are displayed in Figure 1.
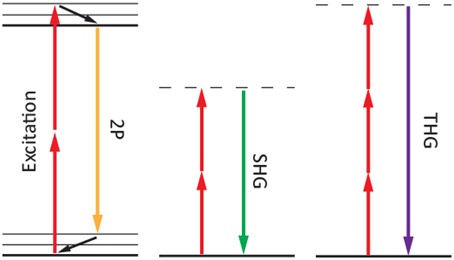
Figure 1: Energy level diagrams describing (2P) fluorescence (left), second-harmonic generation (SHG) (middle), and third-harmonic generation (THG) (right) processes. Solid (dashed) lines indicate electronic (virtual) levels.
C. Coherent Raman Scattering Imaging
Chemically-specific imaging of biological samples is typically performed using either spontaneous Raman scattering microscopy or infrared (IR) absorption microscopy. In IR microscopy, long-wavelength light is used to excite vibrational modes of certain molecules within a sample. Contrast results since at a given wavelength only the sample regions containing the resonant molecules absorb appreciably, while the other regions are transparent. One interesting recent development relevant to this type of microscopy is the advent new IR light sources, such as high-power fixed- and tunable-wavelength quantum cascade lasers (QCLs). While long-wavelength light is ideal for imaging thick specimens, one has to contend with poorer spatial resolution. Strong light absorption by water molecules in the near-IR (NIR) is another problem that limits the use of IR microscopy in biological imaging applications. Spontaneous Raman microscopy, on the other hand, does not suffer from the same issues and is therefore often preferred. In this technique an intense laser beam is raster-scanned across the sample in a confocal microscope configuration. The Raman signal is detected by a spectrometer, which, when fixed at a certain wavelength corresponding to a particular Raman line, enables imaging of only the molecules that emit this line. The main benefit of Raman microscopy are that no exogenous fluorophores are required, photobleaching can be avoided, it works well under a variety of conditions (e.g., temperature and pressure), and it works with different excitation wavelengths (i.e., non-resonant Raman). However, fluorescence interference and weak signals - Raman scattering is an extremely inefficient process with ~ 1 in 108 incident photons Raman scattered - are limiting factors. In the case of the latter, matching the laser wavelength with an electronic transition, i.e., resonant Raman, can be used to enhance intrinsically weak Raman signals in biological samples [11].
To circumvent the shortcomings of spontaneous Raman microscopy, a new type of high-contrast vibrational imaging was developed based on coherent Raman scattering (CRS). CRS microscopy was first demonstrated in the early 1980s [12]. However, it was not until the advent of robust picosecond laser sources that the potential of CRS in biological imaging was fully realized. Coherent Raman scattering comes in two forms: coherent anti-Stokes Raman scattering (CARS) [13, 14] and stimulated Raman scattering (SRS) [15, 16]. Coherent anti-Stokes Raman scattering (CARS) is a nonlinear four-wave mixing process that is used to enhance the weak (spontaneous) Raman signal. In the CARS process, a pump laser beam (at frequency wPump) and a Stokes laser beam (at frequency wStokes) interact, producing an anti-Stokes signal at the optical frequency wCARS = 2wPump – wStokes. When the frequency difference between the pump and the Stokes beams matches the frequency of a vibrational mode (W), the molecular oscillators are coherently driven. The result is an enhanced anti-Stokes (shorter-wavelength) Raman signal that is the basis for the increased vibrational contrast in CARS microscopy.
In SRS microscopy, both the pump and Stokes beams are incident on the sample, as in CARS, but in SRS only a single pump and a single Stokes photon interact. If the frequency difference wSRS = wPump – wStokes matches a molecular vibration (W), stimulated excitation of the vibrational transition occurs. Unlike CARS, in SRS there is no signal at a wavelength that is different from the laser excitation wavelengths. Instead, the intensity of the scattered light at the pump wavelength experiences a stimulated Raman loss (SRL), while the intensity of the scattered light at the Stokes wavelength experiences a stimulated Raman gain (SRG). It is this change in signal intensity that is the basis for image contrast in SRS. Due to the small intensity differences involved in SRL and SRG, phase-sensitive detection schemes are generally employed to extract the SRG and SRL signals from the laser noise.
The main benefits of CRS microscopy are: (i) high-sensitivity, label-free chemical imaging at video rates; (ii) 3D sectioning in thick (> 0.5 mm) tissue samples; (iii) a CRS signal that is free of fluorescence; and (iv) minimal photodamage, as NIR light is used. SRS microscopy has the further benefit that it is background-free, unlike CARS microscopy. In SRS, when the energy difference (wSRS = wpump – wStokes) does not match a specific vibrational response, SRL and SRG do not occur. Therefore, the SRL and SRG signals do not exhibit any nonresonant background. As a result, SRS imaging can provide higher contrast images than CARS, which is important in biomedical imaging applications where water represents the predominant source of nonresonant background signal in the sample. Energy level diagrams that describe the nonlinear coherent Raman processes involved in CARS and SRS are shown in Figure 2. The energy level diagram for the spontaneous Raman process is also shown for comparison.
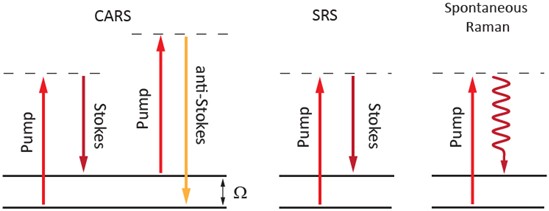
Figure 2: Energy level diagrams describing coherent anti-Stokes Raman scattering (CARS), stimulated Raman scattering (SRS), and spontaneous Raman scattering processes. Solid (dashed) lines indicate electronic (virtual) levels.
As discussed above, several different NLO modalities are available for high-contrast imaging of biological samples, all while maintaining or improving upon the benefits associated with linear optical microscopy techniques, such as laser-scanning confocal fluorescence imaging. At the heart of each NLO imaging technique are advanced ultrafast lasers and laser systems; specialized, hard-coated interference filters; and high-sensitivity detectors. In the following sections, we discuss the importance of each of the aforementioned technologies in NLO imaging applications. Finally, a short discussion on the various types of fluorophores commonly used in NLO microscopy will be presented.
III. Lasers and Laser Systems for Nonlinear Optical (NLO) Imaging
Growth in nonlinear optical bio-imaging owes much, if not everything, to the development of ultrafast laser systems. Prior to the early 1990s, dye lasers capable of producing < 100 fs pulses dominated the field of ultrafast pulse generation. However, the useful tuning range of the dyes used as the lasing medium is only a few tens of nanometers, and thus dyes had to be changed frequently and continuous tuning over a broad wavelength range was not possible. Furthermore, dye lasers typically required constant tweaking in order to optimize the output power. The development of the mode-locked Ti:Sapphire (Ti:S) oscillator in the early 1990s ushered in an era of stable picosecond (1990) and femtosecond (1991) pulsed laser systems capable of spanning a significantly broader spectral range. Not long after the introduction of the mode-locked Ti:Sapphire laser, the very first multiphoton fluorescence imaging paper using this new laser technology was published [17].
A. Lasers and Laser Systems for MP Fluorescence, SHG, and THG Imaging
While the basic microscope platform requirements for nonlinear imaging are similar to those for linear imaging, a key distinction exists—namely, the need in nonlinear optical imaging for ultrafast lasers that can produce very high peak powers. In linear fluorescence microscopy, continuous wave (CW) lasers having a well-defined center wavelength and stable power output in the tens of milliWatt (mW) range are used. This is not the case in 2P fluorescence, SHG, and THG imaging, where tunable femtosecond (fs) laser sources that can deliver high peak powers are necessary. The equations governing the signal dependence of each nonlinear process are

where the terms c(2) and c(3) represent second-order and third-order susceptibilities, respectively, and describe the change in electron distribution of the excited molecule under nonlinear laser excitation, and I(w) represents the intensity of the input laser light. Since the output intensity values depend on the square or cube of the input intensity, a small increase in laser intensity has a dramatic impact on the signal.
In multiphoton fluorescence microscopy it is necessary to confine the excitation laser light in both space and time to increase the probability that the absorption of two (or three) photons raises the molecules (i.e., fluorophores) present in the laser focus from their ground state to an excited state. By considering equation (1), it is obvious that femtosecond laser sources are preferred for MP fluorescence, SHG, and THG imaging, as they can deliver higher peak powers (for a lower average power) compared to an equivalent picosecond laser. A mode-locked femtosecond Ti:Sapphire laser is the most common laser source used in MP fluorescence imaging applications. Many of the fluorophores commonly used in 2P (or 3P) fluorescence imaging can be efficiently excited across the wavelength range 700 - 1000 nm using a single femtosecond Ti:Sapphire laser. The same laser can be used for SHG imaging by tuning the center wavelength to ~ 800 nm and collecting the emitted SHG signal around 400 nm. Similarly, THG imaging is possible simply by tuning the center wavelength to around 1100 nm and collecting the emitted THG light around 370 nm.
Ti:Sapphire lasers are commonly pumped by frequency-doubled diode-pumped solid-state lasers like Nd:YVO4 (neodymium-doped yttrium vanadate). The pump and Ti:Sapphire lasers can be combined into a single compact, user-friendly box or configured as two separate systems. Systems operating over a broader wavelength range 680 – 1100 nm, more common in two-laser configurations, are advantageous when longer-wavelength fluorophores are used. In addition, it is possible to interrupt the mode-locking in a two-laser system, which enables users to verify that the detected fluorescence signal is related to a 2P (or 3P) process from within the sample. Furthermore, the Nd:YVO4 laser can be used directly for long-wavelength MP fluorescence. The self-contained, single-box approach offers the advantage that the lasers can be operated via direct computer control and without the need for an advanced degree in laser physics.
The growing use of 2P fluorescence imaging in biomedical applications places increased demand on the development of femtosecond laser systems that will allow imaging of NIR fluorophores from within thick biological samples, such as tissue sections. Many NIR probes have one-photon absorption maxima within the range 700 - 800 nm, with two-photon excitation occurring over the wavelength range 1400 – 1600 nm. Therefore, there is a need for femtosecond lasers that can deliver high peak powers over this longer wavelength range. One approach used to generate femtosecond laser pulses beyond 1100 nm is to couple an optical parametric oscillator (OPO) to a mode-locked Ti:Sapphire laser. Here, the output from the Ti:Sapphire is used to generate two longer wavelength laser beams, the “signal” and the “idler” beams, from the OPO crystal. Changing the length of the OPO laser cavity results in a fully tunable output and allows continuous tunable coverage from 1000 – 1600 nm, making it possible to use newly developed fluorophores, such as the far-red fluorescent protein, mCherry, which has a 2P excitation peak around 1160 nm [18].
B. Lasers and Laser Systems for CRS Imaging
Owing to the extremely small Raman cross-section of most biological molecules, spontaneous Raman scattering is an intrinsically weak effect and makes high contrast chemical imaging a challenge. To overcome this problem, CRS microscopy makes use of two ultrafast lasers to coherently drive vibrational modes within a sample and thus generate appreciable Raman signals for high contrast imaging. The CARS signal scales cubically with the intensity of the two input laser fields:

where the term c(3)represents the third-order susceptibility, sRaman is the Raman cross-section area, and IPump and IStokes represent the intensities of the two input laser beams. In CARS, the third-order susceptibility
has a resonant contribution (proportional to cR(3)), which is the dominant signal, and a nonresonant contribution (proportional to cNR(3)). The nonresonant signal originates from the nonlinear electronic response of the sample and results
in a broad background signal that reduces image contrast [14].
To generate a Raman signal via four-wave mixing, two pulsed laser beams are required. In CARS microscopy, these two input laser beams are commonly known as the Stokes (at frequency wStokes)
and pump (at frequency wPump) beams. These can be generated either using two synchronized Ti:Sapphire lasers or with a solid-state (Nd:YAG or Nd:YVO4) laser pumped OPO. In CARS microscopy, the Stokes beam is fixed at one wavelength (typically
the wavelength of the solid-state laser, 1064 nm), while the pump laser is tuned across a wide wavelength range (700 – 1000 nm) to satisfy the condition wCARS = 2wPump – wStokes = W, making it possible to excite vibrations
across a broad spectral range, W = 500 – 3250 cm–1. In CARS microscopy, picosecond laser pulses are used. Picosecond pulses of duration 2 – 7 ps have a spectral bandwidth of 3 – 4 cm–1, which is ideally
matched to the linewidths of many prominent Raman features. Femtosecond laser pulses deliver more peak power; however, their spectral linewidths are typically 150 cm–1 in the NIR and are therefore not suitable for exciting lower-lying
vibrational modes. In biological imaging, CARS is most often used to image the CH2 stretch resonance found in lipids. In this case the Stokes beam (wPump<) is fixed at 1064 nm, with the pump beam (wPump) tuned to a wavelength of ~ 816
nm. The corresponding energy difference matches the center frequency of the CH2 stretch around ~ 2850 cm–1. To excite the OH stretch in water (H2O), the pump beam (wPump) can be tuned to ~ 790 nm, corresponding to a frequency
of W ~ 3250 cm–1.
The same picosecond laser sources used in CARS microscopy can also be used in stimulated Raman scattering (SRS) microscopy. In SRS imaging, when the condition wSRS = wPump – Stokes = Wis satisfied, it is possible to generate an enhanced Raman signal by virtue of stimulated excitation. In this process, the intensity of the Stokes beam, IStokes, experiences a gain DIStokes (stimulated Raman gain, SRG) while the intensity of the pump beam, IPump, experiences a loss, DIPump (stimulated Raman loss, SRL). The relative SRS intensity gain (SRG, DIStokes/IStokes) and loss (SRL, DIPump/IPump) are described mathematically by
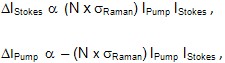
where N is the number of molecules in the probe volume and sRaman is the Raman cross-section area. In SRS the Stokes beam ((wStokes) is again typically fixed at a wavelength of 1064 nm (7 ps, ~ 3 cm–1) while the pump beam (wPump) is tuned across the wavelength range 700 – 1000 nm. The main difference between CARS and SRS microscopy is that SRS employs a high-frequency phase-sensitive detection scheme to extract the small SRL and SRG signals from background noise. For SRL, the intensity of the Stokes beam is modulated, whereas for SRG the intensity of the pump beam is modulated. In this way, it is possible to detect intensity changes (DI/I) that would otherwise be buried in the laser noise and allow for fast Raman imaging with high SNR [15]. Furthermore, because the Raman signal is enhanced significantly compared to spontaneous Raman scattering, video-rate chemically specific imaging is possible.
Both CARS and SRS techniques offer a viable route to high-contrast, high-speed chemical imaging. One drawback of CARS microscopy lies in the fact that image contrast can be compromised by the presence of the inherent nonresonant background signal. A method to circumvent this issue based on a third laser has been demonstrated [19]; however, the requirement for an additional laser hinders its applicability in most cases based on cost. Thus, despite the increased complexity of SRS microscopy, the ability to solve the issue of the nonresonant background that affects CARS imaging will likely lead to the widespread adoption of SRS as the premier chemical-imaging approach for biological imaging applications.
Laser technologies used in NLO imaging have become well-established, robust, and reliable commercial, turn-key systems are now available. One drawback, however, is that such laser systems remain expensive and typically have a large footprint. Therefore, alternative approaches that do not sacrifice laser performance for affordability are required to facilitate the transition of NLO imaging from a research technique into a medical diagnostic tool for use in a hospital environment. Recent developments in fiber laser technology have shown that compact, high-power, ultrafast laser systems are possible and could speed the transition of NLO imaging from bench to bedside. For example, development of widely tunable erbium-doped fiber lasers has demonstrated compact laser systems capable of producing picosecond pulses with sufficient peak power such that high-contrast CARS imaging is possible [20]. As laboratory-based efforts to develop compact ultrafast laser systems for NLO imaging applications continue, commercial all-fiber ultrafast systems are being launched. Genia Photonics recently launched a synchronized, fully programmable compact fiber laser platform that delivers picosecond pulses with high peak power suitable for CARS imaging. The added benefit of this system is that all laser parameters are configured through an intuitive computer-controlled user interface that requires minimal user intervention, thus making it an ideal choice for those who prefer not to have to tweak the laser alignment. A list of various lasers and laser systems for NLO imaging is provided in Table 1.
| Coherent | Spectra-Physics | APE Berlin | Genia Photonics | Clark-MXR |
Laser model/type | Chameleon Ti:Sapphire / OPO | InSight DeepSee | picoEmerald OPO / Nd:YAG | 2 fully integrated fiber lasers | 2 synchronized OPAs |
Tuning Range (nm) | Chameleon: 780-1080 OPO: 1000-1600 | 680-1300 | Signal: 720-990 Idler: 1150-2030 | 752-785, 815-865, 1030-1130 | OPA: 650-1030 Residual: 1030 |
Avg. Power (mW) | Ti:Sapphire: 700 OPO: 550 | > 500 | Signal: 600 Idler: 500 Fundamental: 750 | 100 per wavelength | OPAs: 100 1030: 2000 |
Pulse Width | Chameleon: 140 fs OPO: 200 fs | < 120 fs | 7 ps | 20 ± 5 ps | 8 ps – 200 fs |
Rep Rate (MHz) | 80 | 80 | 80 | 10 – 50 | 1 - 5 |
NLO Technique | MP/SHG/THG/CRS | MP/SHG/THG/CRS | CRS | MP/CRS | MP/SHG/THG/CRS |
Table 1: Various ultrafast lasers and laser systems used in multiphoton (MP) fluorescence and coherent Raman scattering (CRS) microscopy. The information provided in this table was sourced directly from the websites of the listed companies. OPO – optical parametric oscillator; OPA – optical parametric amplifier.
IV. Optical Filters for Nonlinear Optical Imaging
As discussed in the previous section, the generation of stable and well-defined picosecond and femtosecond laser pulses is crucial in NLO microscopy. The ability to precisely control the various light signals involved in generating NLO optical emission using ultrafast laser pulses is equally important. Precise spectral control of light is now readily achieved through innovation in the design and manufacture of hard-coated optical filters, with a myriad of options available. In the following section we describe the most important aspects that must be considered when designing filters for use in NLO imaging applications and highlight their benefits.
A. Optical Filters for MP Fluorescence, SHG, and THG Imaging
In MP, SHG, and THG imaging, precise control of several different fluorescence light emission wavelengths from the near-UV to the NIR is required. Therefore, careful consideration must be given when selecting the appropriate dichroic beamsplitter, used to direct the excitation light toward the sample, and appropriate matching emission filters to efficiently transmit a select portion of the emitted fluorescence before it reaches the microscope detector. To achieve the most efficient and precise spectral control in multiphoton fluorescence imaging, it is beneficial to design dichroic beamsplitters and emission filters as matched pairs. An example of such an emitter-dichroic matched pair is shown in Figure 3 (left).
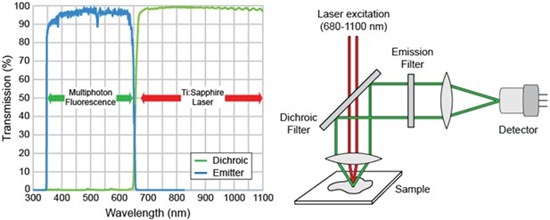
Figure 3: Linear transmission plot of the spectral characteristics of a matched dichroic-emitter pair (left). Schematic of a multiphoton microscope configured in a transmission geometry (right).
Most multiphoton microscopes use a femtosecond Ti:Sapphire laser. Therefore, dichroic beamsplitters should provide high transmission across the full tuning range of the laser (typically > 95%) as well as high reflection (typically > 98%) all the way down into the near-UV. Dichroics that provide high transmission beyond 1200 nm are becoming common for long-wavelength multiphoton imaging, where the use of longer wavelengths allows for greater penetration in thick samples. To provide enhanced performance dichroic beamsplitters for MP fluorescence imaging applications should exhibit a steep transition edge that defines the boundary between the characteristic reflection and transmission bands. Greater use of the available laser power below ~ 700 nm is thus allowed, as well as detection of fluorescence emission beyond ~ 600 nm when combined with a matched emission filter. To meet this requirement, steep transition edges on the order of 30 nm are built into the design of all Semrock multiphoton dichroic filters. Figure 3 (right) shows a schematic of a multiphoton microscope configured in transmission geometry. In this example, the dichroic filter is used to pass the excitation laser light while the emitted fluorescence is reflected toward the detector channel.
Spectral control of the emitted fluorescence is achieved by placing a matched emission filter directly in front of the detector. For maximum performance, the emission filter should provide high transmission across the range of wavelengths where fluorescence emission occurs (typically > 95%), and high out-of-band blocking elsewhere. Emission filters designed to transmit light from the near-UV to NIR are the ideal choice in MP fluorescence, SHG, and THG imaging. One of the main benefits of using such an emitter-dichroic matched pair is that it eliminates the need to swap out filters to collect various different NLO light signals. In addition, costs can be reduced, as only one emission filter is required.
Because high power lasers and sensitive PMT detectors are used in MP fluorescence, SHG, and THG, it is imperative that stray laser light be adequately controlled. Here, emission filters for imaging applications are designed to provide out-of-band blocking with optical density (OD) from 6 to 8 across the entire tuning range of the excitation laser. An example of the extended blocking features of a short-wave-pass (SWP) emission filter (Semrock FF01-680/SP) that can be used in 2P fluorescence imaging, for example, is shown in Figure 4. In this example, the emission filter is designed to collect multiphoton fluorescence from the near-UV (350 nm) to the visible (650 nm) and provide OD >8 blocking from 680 nm to 1100 nm. Extended out-of-band blocking with OD > 6 can also be achieved by using dual-substrate filters; however, this approach is not ideal. Dual-substrate filters require multiple (i.e., four) different coating runs, and if the filter edges are not controlled properly during the manufacture process, degraded spectral performance is more likely. For this reason, single-substrate coatings that provide transmission in the near-UV and extended blocking out to 1100 nm are the optimum choice for NLO imaging experiments involving 2P fluorescence, SHG, and THG.
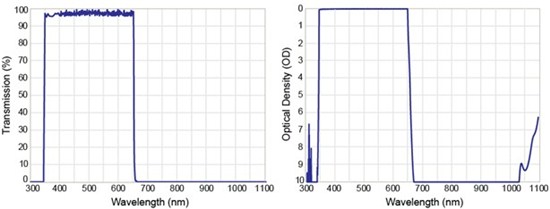
Figure 4: Linear transmission profile for a short-pass emission filter (FF01-680/SP) designed for multiphoton fluorescence imaging (left). The out-of-band blocking performance is also shown (right).
B. Optical Filters for Coherent Raman Scattering Imaging
Because coherent Raman scattering (CRS) microscopy requires the use of two independent picosecond laser sources, careful consideration is required when designing filters to enable high-contrast imaging. Efficient coupling of the excitation light from both laser sources into the microscope head is critical. Coupling can be readily achieved by using a “notch dichroic beamsplitter” designed to work at 45°. In most CARS/SRS experiments, the Stokes beam (lStokes = 1064 nm) is directed into the microscope via reflection off the notch dichroic while the pump beam (<lPump= 700 – 1000 nm) is transmitted through the same dichroic. Additional optical components are required to precisely spatially overlap the beams before they enter the microscope head. The design spectrum of such a notch dichroic is shown in Figure 5. The main features of this beamsplitter are > 95% transmission across the wavelength tuning range of the pump laser and a narrow reflection band centered at the output wavelength of the Stokes laser. Extended high transmission across the wavelength range 700 – 1000 nm and beyond 1150 nm makes this design suitable when combining CRS imaging with one or more additional NLO techniques, including MP fluorescence, SHG, and THG.
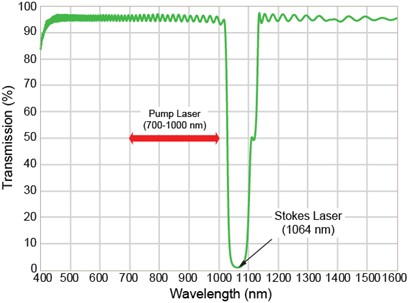
Figure 5: Linear transmission profile of a notch dichroic beamsplitter (Semrock NFD01-1064) for CRS imaging. The dichroic was designed to allow the combination of two picosecond NIR laser beams when positioned at 45°. The notch is centered at 1064 nm to reflect the Stokes beam (wStokes), with the pump beam (>wPump) being transmitted across 700 – 1000 nm. The same notch dichroic can also be used when combining CRS and other NLO imaging modalities, such as 2P fluorescence.
Specialized, hard-coated emission filters used for detecting the enhanced Raman scattered light associated with CARS and SRS are also required. The spectral performance of emission filters for use in CRS is similar to that of emission filters designed for MP fluorescence imaging: > 95% transmission across the passband and OD > 6 out-of-band blocking across all laser wavelengths. Linear transmission and blocking performance of emission filters designed for CARS (top) and SRS (bottom) microscopy are shown in Figure 6. For CARS imaging, it is conceivable to use a wideband multiphoton emission filter (as in Figure 4) to spectrally select the Raman scattered light. However, in this case, such an emission filter would also transmit the broad nonresonant background light, thus reducing overall image contrast. To solve this issue, the passband of the emission filter FF01-625/90 was specifically designed to transmit only the desired CARS signals, such as the CH2 stretching vibration from lipids, while blocking the broad nonresonant background across the visible. In SRS microscopy, the key requirement is to provide > 95% transmission across the entire tuning range of the pump source from 700 to 1000 nm, while efficiently blocking the Stokes laser at 1064 nm. To meet this need, a new bandpass filter, FF01-850/310, was designed. The linear transmission and out-of-band blocking for this new filter are shown in Figure 6 (bottom).
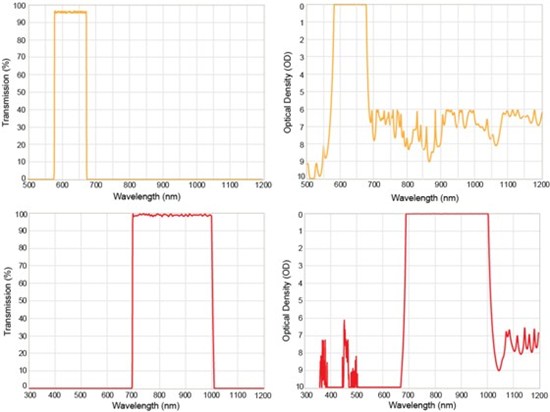
Figure 6: Plots of the linear transmission and out-of-band blocking for two emission filters designed for coherent anti-Stokes scattering (CARS) (FF01-625/90, top) and stimulated Raman scattering (SRS) (FF01-850/310, bottom) microscopy.
C. Out-of-Band Blocking Requirements for Emission Filters
A question that is asked often is whether OD 6 blocking is adequate in laser-based optical microscopy, or should emission filters be designed to provide OD 7 or even OD 8 blocking? The simplest way to understand this is to consider the following example
based upon the two-photon microscope configuration shown in Figure 3, whereby a sample of fluorescein is held on a glass microscope cover slip. First let us conservatively assume the detector responds equally to both the laser and fluorescence wavelengths.
A laser beam producing 1mW of 900 nm light will produce 4.5 x 10¹⁵ photons per second. Focusing this light onto the sample will result in ~ 2 x 10⁵ fluorescence photons per second. Now, we assume that 4% of the incident laser light is reflected
from the glass cover slip, and so approximately 2 x 10¹⁴ photons are sent back along the optical path and can reach the detector. By comparison, a laser producing 100 fs laser pulses at a repetition rate of 80 MHz will produce approximately
2 x 10⁹ two-photon fluorescence photons per second from the same fluorescein sample. Thus there are about 105 fewer signal photons than the number of laser ‘noise” photons scattered from the sample. To achieve a reasonable signal-to-noise
of ~ 10 or more, one needs to use an emission filter that provides OD 6 or greater out-of-band blocking to prevent the reflected laser light from reaching the detector and reducing the overall image contrast. However, in most real two-photon microscopes
the detector has a much lower response at the laser wavelength than the two-photon fluorescence wavelengths, so generally OD 6 blocking is more than enough.
D. Dichroic Filters for Reflection-Mode Nonlinear Imaging
Most nonlinear optical imaging microscopes are configured in transmission geometry, as shown in Figure 3; however, there are cases where, for example, multiphoton microscopes are configured to operate in the so-called reflection geometry, where the excitation light is reflected off the dichroic beamsplitter and the fluorescence or other NLO signal is transmitted through it. Generally the transmission geometry is preferred in NLO imaging for two reasons: (i) the reflectivity of a dichroic beamsplitter is higher than the transmission, so by reflecting the signal as many precious signal photons as possible are preserved whereas the loss of a few excitation photons is tolerable, and (ii), it is easier to control the dispersion of light in transmission through a filter than it is in reflection (see discussion below), and dispersion of the excitation light is more critical than that of the signal light. Sometimes the reflection geometry is used, however. Traditionally linear microscopes are arranged this way for historical reasons and because fewer aberrations result when the signal (imaging) beam is transmitted through a imperfect 45° dichroic beamsplitter than occur in reflection.
Careful consideration must be given to the design of dichroic beamsplitters due to the effects of dispersion on the femtosecond laser pulses used for excitation. This problem is particularly important in the reflection geometry, since dispersion resulting from the reflection of light off an interference filter is more difficult to control than for light transmitted through a filter. Dispersion is the variation of the speed of a wave with wavelength. Material dispersion results from the variation of the refractive index of light with wavelength, resulting in some wavelengths of light being delayed more than others as they pass through the material. Dispersion in a thin-film filter further results from the variation in delay of different wavelengths of light due to the complex interference that occurs within the thin-film layers. Because lasers used in linear microscopy operate in continuous wave (CW) mode, dispersion is not a significant issue. However, dispersion is a common problem in ultrafast laser applications and must be controlled. Very short (fs) pulses have consist of an appreciably wide bandwidth of wavelengths, and thus when those different wavelengths are delayed by different amounts as they pass through a dispersive material or filter, the narrow pulse broadens. Since NLO effects are dramatically impacted by the peak intensity of the pulse, a broadened pulse requires a higher energy-per-pulse to achieve the same peak intensity, thus requiring an increased average power which can damage the sample and limit the depth of penetration for 3D imaging.
The primary goal when designing a dichroic beamsplitter for reflection mode MP fluorescence imaging is to provide dispersion properties that are smooth and slowly varying with wavelength. The main dispersion parameter that must be controlled is known as the Group Delay Dispersion (GDD), which directly describes the wavelength dependent delay of the various spectral components of the incident pulse that cause pulse broadening. Fortunately GDD can be controlled (within physical limits) by optimizing the design of a thin-film filter coating. Semrock’s FF670-SDi01 and FF720-SDi01 short-wave pass (SWP) dichroic beamsplitters are examples of thin-film interference filters manufactured using ion-beam sputtering. Both filters were designed specifically to reflect the laser light toward the sample while transmitting the returning near-UV and visible 2P and 3P fluorescence as well as SHG and THG. For example, a 100 fs transform-limited Gaussian laser pulse experiences less than 2% broadening upon reflection over the full laser wavelength range for the FF670-SDi01 filter, with less than 1% broadening for the FF720-SDi01 filter.
The linear transmission and group delay dispersion (GDD) design spectra are shown in Figure 7. For the FF670-SDi01 beamsplitter (top), the GDD is designed to be a very smooth curve that varies slowly with wavelength and remains within ± 500 fs2 between 705 and 1075 nm for s-polarized light and between 725 and 1040 nm for p-polarized light. Furthermore, the difference between the GDD for s-polarized and p-polarized light is less than ± 100 fs2 between 730 and 1030 nm. For the FF720-SDi01 beamsplitter (bottom), the GDD for both s- and p-polarized light, as well as the difference between GDD for the two polarizations, is designed to be less than ± 30 fs2 between 750 and 875 nm. The low GDD and small slope of the GDD curve allows significantly deeper imaging into thick specimens and reduces the required energy-per-pulse and therefore average power, thus limiting the possibility of photodamage. Keeping the GDD for s-polarized light approximately equal to that for p-polarized provides additional benefits to those users who want to investigate polarization effects.
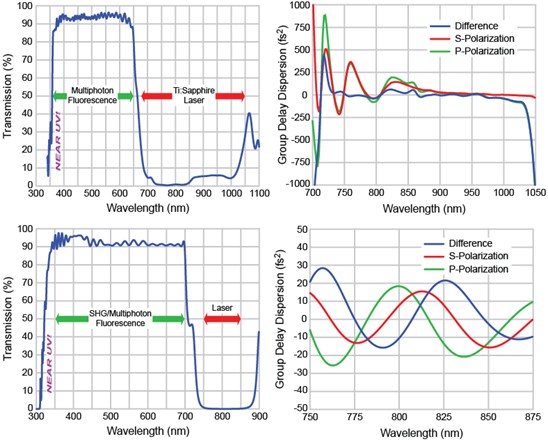
Figure 7: Linear transmission profiles and group delay dispersion (GDD) plots for Semrock’s FF670-SDi01 (top) and FF720-SDi01 (bottom) short wave pass dichroic filters designed for reflection mode MP fluorescence imaging.
V. Detectors for Nonlinear Imaging Applications
Light detection in nonlinear optical imaging is just as critical as it is in other forms of optical microscopy, if not more so. The most common type of detector used in nonlinear optical microscopy is the photomultiplier tube (PMT), which operates in either photoelectric effect or thermal modes. When operating as a thermal detector, a PMT’s response is wavelength independent, and so it can be used with nearly any wavelength of light. The major drawback with thermal PMTs is their inherently low sensitivity across all wavelengths. For this reason, PMTs based on the photoelectric effect are used in NLO imaging applications. For photoelectric effect PMT, light of energy h that strikes the photocathode results in the ejection of an electron having energy K = h n – W, where K is the kinetic energy of the ejected electron, h is Planck’s constant, n is the frequency of the light, and W is the work function of the photocathode material. The ejected electrons are then directed by a focusing electrode to strike the first of a series of dynodes. Each dynode is held at increasing (positive) voltage and is used to accelerate the emitted electrons through the electron multiplier tube to the anode. The accumulated charge at the anode generates a current. A voltage is then measured across a load of known resistance and can be related to the initial photon strike.
One of the most important aspects to consider when selecting a suitable PMT detector is the wavelength range over which the nonlinear fluorescence or coherent Raman signal is emitted. Various different materials that provide high quantum efficiency (QE) can be used for the photocathode. For NLO imaging experiments where it is necessary to detect SHG and THG signals, for example, a PMT that detects photons with high efficiency around 400 nm is required. Here, alkali materials such as antimony-rubidium (Sb-Rb), antimony-potassium (Sb-K), or antimony-sodium (Sb-Na) are suitable and provide high sensitivity from the ultraviolet (300 nm) to NIR (700 nm). For detection across the visible (400 - 650 nm), gallium-arsenide-phosphide (GaAsP) PMTs are commonly used. GaAsP-based detectors offer quantum efficiencies up to ~ 40% (at ~ 500 nm), which is close to the theoretical limit (of 50%) for a photocathode device. The same type of PMT detector can also be used to detect 2P fluorescence emission. Efficient detection above 650 nm requires a different photocathode material. Here, GaAs is a popular material choice and can be used to detect light up to 850 nm. Multialkali detectors that extend the detection range to ~ 900 nm are available and are typically used when increased sensitivity in the NIR is required. The spectral response of three different PMT detectors is shown in Figure 8.
With high (106) gain and low dark current (noise), the signal-to-noise (SNR) ratio is typically very high for PMTs. The high detection efficiency provided by several common PMT materials also facilitates the use of lower excitation powers, which can be important in NLO imaging experiments that involve imaging live samples and where photodamage and phototoxicity are concerns. In addition, since confocal detection is not required, there is no need for an imaging detector, such as a silicon-based charge-coupled device (CCD) or CMOS camera, and so PMTs offer an ideal choice. With a basic understanding of the most pertinent detection parameters, such as quantum yield and responsivity, and knowledge of their variation across a wide range of detection wavelengths, it is relatively straightforward to select the optimum detector for a given NLO imaging application. Additional information on various PMT detectors can be found in Ref [21].
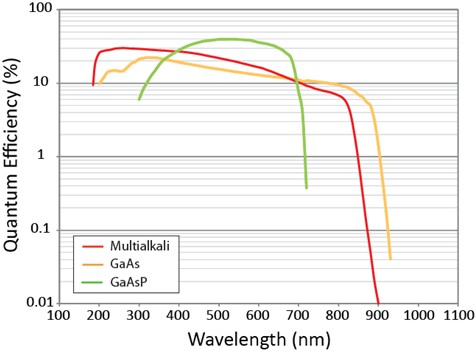
Figure 8: Spectral response curves for three different PMT detectors commonly used in NLO imaging applications. Note that the multialkali materials provide improved spectral response in the near-UV and NIR, whereas a GaAsP-based PMT provides greater sensitivity across the visible. Data courtesy of Hamamatsu Photonics.
VI. Fluorophores for NLO Imaging
One of the main goals of NLO imaging is to permit label-free, high contrast imaging. Label-free imaging of biological samples is readily achieved using SHG, THG, CARS, and SRS microscopy, where contrast is derived from the intrinsic nonlinear emission under ultrafast laser excitation. NLO imaging using endogenous fluorophores is another approach commonly employed in 2P and 3P fluorescence microscopy. However, for certain experiments, the use of exogenous fluorophores in MP fluorescence imaging is unavoidable; therefore, it is worthwhile to consider the various different types of exogenous and endogenous fluorophores used in NLO imaging applications and the advantages they provide.
A. Exogenous (Extrinsic) Fluorophores
Multiphoton fluorescence imaging is possible using a myriad of different exogenous fluorophores. Many of the same fluorophores used in linear fluorescence imaging, for example, can also be used in MP fluorescence imaging. A crude yet simple method for determining whether or not a fluorophore is suitable for 2P fluorescence imaging experiments is to double the maximum one-photon (1P) excitation wavelength. However, it is necessary to have a firm understanding of the molecular symmetry possessed by the fluorophore, as 1P and 2P excited state transitions can differ significantly. For the case of molecules that possess symmetry 1P, transitions to excited states are allowed, while 2P excited transitions are forbidden. Rhodamine and AlexaFluor 488 are examples of small molecule dyes that are commonly used in both 1P and 2P fluorescence imaging. Fluorescent proteins (FPs) have found growing use in 2P fluorescence imaging of biological samples [2,22]. Owing to their bright emission and size-dependent spectral properties, which are controlled via synthesis, quantum dots are another viable labeling option for 2P fluorescence imaging, although they first must be made water soluble for use in biological samples [23]. Typically in SHG imaging, no fluorophore is required, as one intentionally exploits intrinsic nonlinear properties of the sample. However, novel SHG nanoparticles have been developed and can be used to label samples. The benefits of this approach are that SHG nanoparticles do not bleach like organic dyes or blink like quantum dots, and they even work at high laser power [24]. Understanding which fluorophore will work best for a given NLO imaging modality depends on the sample under study and the intrinsic properties of the fluorophore. Two of the most important properties to consider for a given fluorophore are the intrinsic quantum yield (QY) and the MP absorption cross-section, both of which are wavelength dependent.
B. Endogenous (Intrinsic) Fluorophores
In many cases, label-free imaging of biological samples is preferred. A key factor driving the switch to label-free imaging is the push to develop nonlinear optical imaging techniques as medical diagnostic tools. For obvious reasons it is undesirable to have to “label” a patient with fluorophores before examination, even though the use of radiotracers in PET imaging has been common practice for many years. Therefore, alternative sources of fluorescence are desired.
Several sources of intrinsic fluorescence are present in tissue samples and cells, and although for most of these the associated MP absorption cross-sections are extremely small, they are sufficient to provide appreciable image contrast. As an example,
the 2P absorption cross-section of NADH is s2P < 10–4 GM (the unit GM refers to the accepted unit of measure for 2P absorption events and is named after the physicist Maria Goeppert-Mayer; one GM is equal to 10–50 cm4 sec).
By comparison, a typical quantum dot has an absorption cross-section s 2P ~ 104. For cellular imaging experiments it is possible to efficiently excite several intrinsic fluorophores using two or three photons. Examples of the types
of endogenous fluorophores used in label-free MP fluorescence imaging are: NADH, flavins, retinol, tryptophan, serotonin, and melatonin. Extracellular sources of intrinsic fluorescence are elastin and collagen protein. Two-photon fluorescence
is commonly used to image elastin, while SHG microscopy is used to image collagen protein. A list of exogenous (extrinsic) and endogenous (intrinsic) fluorophores commonly used in nonlinear fluorescence imaging is provided in Table 2. References are
also provided.
Fluorophores | Exogenous or Endogenous | NLO Process | Excitation Wavelength (nm) | Reference |
Rhodamine B | Exogenous | 2P | 700 – 750 | [3] |
AlexaFluor 488 | Exogenous | 2P | 760 – 790 | [25] |
GFP | Exogenous | 2P | 930 – 950 | [2] |
RFP | Exogenous | 2P | 1050 – 1100 | [2] |
mCherry | Exogenous | 2P | 1150 – 1170 | [18] |
NADH | Endogenous | 2P | 690 – 730 | [3] |
Lipofuscin | Endogenous | 2P | 700 – 850 | [3] |
Tryptophan | Endogenous | 3P | 700 – 740 | [3] |
Serotonin | Endogenous | 3P | 700 – 720 | [3] |
Collagen | Endogenous | SHG | 700 – 740 | [3] |
Microtubules | Endogenous | SHG | 700 – 740 | [3] |
Table 2: Multiphoton excitation properties of several exogenous (extrinsic) and endogenous (intrinsic) fluorophores commonly used in nonlinear optical imaging.
VII. Summary
The exploitation of nonlinear optical effects in biomolecules has opened up a new realm of biological imaging in the life and medical sciences. By integrating several different yet complimentary nonlinear optical imaging modalities - such as two-photon fluorescence, second- and third-harmonic generation, and coherent Raman scattering - it is possible to probe a variety of different biological processes and structures at the molecular level. Preclinical laboratory studies of fat accumulation in animal models have demonstrated how NLO imaging can be deployed to tackle complex issues and questions of disease progression [25]. The march toward the increased use of NLO imaging techniques in translational research continues at a fast pace; however, several important technical and nontechnical challenges remain. The most notable technical challenge that must be addressed is how to increase the penetration depth at which it is possible to clearly resolve cellular structures in biologically functioning tissue without sacrificing image quality. To meet these challenges, further advances are needed in the key technologies used in NLO imaging, including ultrafast lasers, hard-coated optical filters, PMT detector technologies, and in the development of biocompatible and photostable NIR probes. High cost is another critical challenge. On this front, developments are required to reduce the overall complexity and footprint of the ultrafast lasers used. As progress is made across all fronts, it is highly probable that NLO imaging will make the transition from bench to bedside and thus become an indispensible tool for disease diagnosis in humans.
References
[1] W.R. Zipfel, et. al., Nature Biotechnology, 21, (12), (2003), 1369-1377
[2] H. Kawano, et. al., Nature Methods, 5, (5), (2008), 373-374
[3] W.R. Zipfel, et. al., PNAS, 100,
(12), (2003), 7075-7080
[4] Y.R. Shen, The Principles of Nonlinear Optics, John Wiley & Sons, 1984
[5] N. Olivier, et. al., Science, 329, (2010), 967-971
[6] I. Freund, et. al., Biophysical Journal, 50,
(1986), 693-712
[7] L.G. Gouy, C. R. Acad. Sci. Paris, 110, (1890), 1251
[8] R.W. Boyd, J. Opt. Soc. Am., 70 (7), (1980), 877
[9] M. J. Farrar, et. al., Biophysical Journal, 100,
(2011), 1362–1371
[10] C.P. Pfeffer, et. al., J. Struct. Biol., 164, (1), (2008), 140-145
[11] L.A. Popova, et. al., J. Am. Chem. Soc., 132, (18), (2010), 6324-6328
[12] M.D. Duncan,
et. al., Optics Letters, 7, (8), (1982), 350-352
[13] A. Zumbusch, et. al., Phys. Rev. Lett., 82, (1999), 4142
[14] C. Evans and X. S. Xie, Annual Review of Analytical Chemistry, 1,
(2008), 883-909
[15] C. W. Freudiger, et. al., Science, 322, (2008), 1857-1861
[16] P. Nandakumar, et. al., New J. Phys., 11, (2009), 033026
[17] P.F. Curley, et. al., Opt. Quant. Electron, 24,
(1992), 851-859
[18] T. Vadakkam, et. al., J. Fluorescence, 19, (6), (2009), 1103-1109
[19] O. Burkacky, et. al., Optics Letters, 31, (2), (2006), 3656-3658
[20] R. Selm, et. al., Optics Letters, 35,
(19), (2010), 3282-3284
[21] Photomultiplier Tubes: Basics and Applications, 3rd Ed., Hamamatsu
[22] K.D. Piatkevich, et. al., PNAS, 107, (12), (2010), 5369-5374
[23] D.R. Larson, et. al., Science, 300,
(2003), 1434-1436
[24] P. Pantazis, et. al., PNAS, 107, (33), (2010), 14535-14540
[25] R.S. Lim, et. al., Journal of Lipid Research, 51, (2010), 1729-1737
Acknowledgements
The authors wish to acknowledge technical discussions and other contributions from the following people: Prof. E. Potma (UC Irvine), Prof. A. Volkmer (University of Stuttgart), Tegy Vadakkam (Baylor College of Medicine), and Adam Palmentieri (Hamamatsu Photonics).
Authors
Neil Anderson, Ph.D. and Turan Erdogan, Ph.D.and Turan Erdogan, PhD,