Life Science Optics

Conventional spectral imaging systems are generally not able to offer the key advantages of thin-film interference filters, i.e., high transmission combined with steep spectral edges and high out-of-band blocking. Now with VersaChrome filters, these advantages
can be realized in simple spectral imaging systems for applications ranging from fluorescence microscopy to hyperspectral imaging.
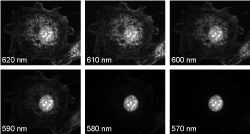
To demonstrate spectral imaging in a fluorescence microscope, a “lambda stack” of images (corresponding
to a nearly continuous series of emission wavelengths) was acquired of a sample labeled with three spectrally overlapping fluorophores using a Semrock VersaChrome tunable filter (TBP01-620/14) placed in the emission channel of a standard upright microscope.
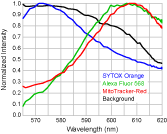
Figure 1 shows six of the 61 images taken at 1 nm intervals, and Figure 2 shows measured intensity spectra taken from parts of the image where only a single fluorophore is present. The nucleus labeled with SYTOX® Orange can be easily
discriminated from the other cellular structures (Fig. 1). However, since the F-actin and mitochondria are labeled with fluorophores that are highly overlapping (Alexa Fluor™ 568 and MitoTracker® Red, respectively),
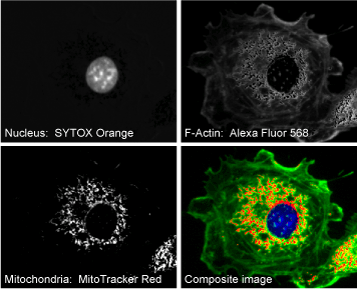
linear unmixing is necessary to discern the corresponding cellular constituents. Images deconvolved with linear unmixing are shown in Figure 3.
It is important to note that the spectral properties of these tunable filters are almost identical
for both s and p polarizations of light – a feature that cannot be easily obtained using liquid-crystal and acousto-optic tunable filters. Polarization independence is highly desirable for spectral imaging systems, and yet polarization limitations
of current tunable filters account for a loss of at least half of the signal in most instruments. Therefore VersaChrome filters not only enhance the throughput in spectral imaging but they also greatly simplify the complexity of instrumentation.

Figure 1

Figure 2

Figure 3